TM 7-1
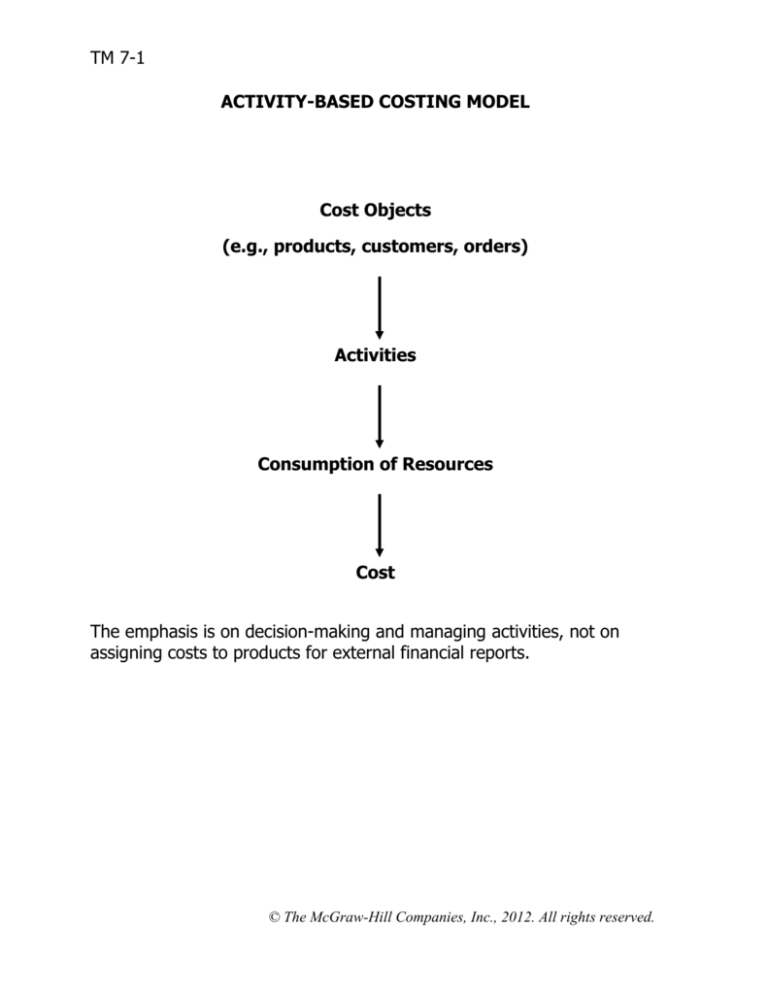
ACTIVITY-BASED COSTING MODEL
Cost Objects
(e.g., products, customers, orders)
Activities
Consumption of Resources
Cost
The emphasis is on decision-making and managing activities, not on
assigning costs to products for external financial reports.
© The McGraw-Hill Companies, Inc., 2012. All rights reserved.
TM 7-2
DIFFERENCES BETWEEN TRADITIONAL COSTING
AND ACTIVITY-BASED COSTING
• In traditional costing systems:
• All manufacturing costs are assigned to products whether or not they
are caused by the products.
• Nonmanufacturing costs are not assigned to products—even those
nonmanufacturing costs that are caused by the products.
• The entire facility may have only one overhead cost pool and a single
measure of activity such as direct labor-hours.
• Predetermined overhead rates are based on estimated costs at the
budgeted or expected level of activity.
• In activity-based costing:
• Nonmanufacturing costs, as well as manufacturing costs, may be
assigned to products.
• Some manufacturing costs may be excluded from product costs.
• There are a number of overhead cost pools, each of which has its own
unique measure of activity.
• The allocation bases (i.e., measures of activity) often differ from those
used in traditional costing.
• The activity rates (i.e., overhead rates) may be based on the level of
activity at capacity rather than on the budgeted or expected level of
activity.
© The McGraw-Hill Companies, Inc., 2012. All rights reserved.
TM 7-3
STEPS FOR IMPLEMENTING ACTIVITY-BASED COSTING
1.
Define activities, activity cost pools, and activity measures.
2.
Assign overhead costs to activity cost pools.
3.
Calculate activity rates.
4.
Assign overhead costs to cost objects using the activity rates and
activity measures.
5.
Prepare management reports.
© The McGraw-Hill Companies, Inc., 2012. All rights reserved.
TM 7-4
COST HIERARCHY
1.
Unit-level activities are performed each time a unit is produced. The
costs of unit-level activities should be proportional to the number of
units produced.
2.
Batch-level activities are performed each time a batch is handled or
processed, regardless of how many units are in the batch. Costs at the
batch level do not depend on the number of units produced, the
number of units sold, or other unit-level measures of volume.
3.
Product-level activities relate to specific products and typically must be
carried out regardless of how many batches or units of product are
produced or sold.
4.
Customer-level activities relate to specific customers and include
activities such as sales calls, catalog mailings, and general technical
support that are not tied to any specific product.
5.
Organization-sustaining activities are carried out regardless of which
products are produced, how many batches are run, or how many units
are made.
© The McGraw-Hill Companies, Inc., 2012. All rights reserved.
TM 7-5
THE CLASSIC BRASS EXAMPLE
Activity Cost Pool
Activity Measure
Customer Orders
Product Design
Order Size
Customer Relations
Other
Number of customer orders
Number of product designs
Machine-hours
Number of active customers
Not applicable
© The McGraw-Hill Companies, Inc., 2012. All rights reserved.
TM 7-6
THE CLASSIC BRASS EXAMPLE (continued)
© The McGraw-Hill Companies, Inc., 2012. All rights reserved.
TM 7-7
THE CLASSIC BRASS EXAMPLE (continued)
Exhibit 7-3
Annual Overhead Costs
(both Manufacturing and Nonmanufacturing)
at Classic Brass
Production Department:
Indirect factory wages ......................
Factory equipment depreciation ........
Factory utilities.................................
Factory building lease .......................
$500,000
300,000
120,000
80,000 $1,000,000
General Administrative Department:
Administrative wages and salaries .....
Office equipment depreciation...........
Administrative building lease .............
400,000
50,000
60,000
510,000
Marketing Department:
Marketing wages and salaries ...........
Selling expenses...............................
250,000
50,000
300,000
Total overhead cost ..............................
$1,810,000
© The McGraw-Hill Companies, Inc., 2012. All rights reserved.
TM 7-8
THE CLASSIC BRASS EXAMPLE (continued)
Exhibit 7-4
Results of Interviews
Customer
Orders
Activity Cost Pools
Product
Customer
Design Order Size Relations
Other
Total
Production Department:
Indirect factory wages.................
Factory equipment depreciation ...
Factory utilities ...........................
Factory building lease .................
25%
20%
0%
0%
40%
0%
10%
0%
20%
60%
50%
0%
10%
0%
0%
0%
5%
20%
40%
100%
General Administrative Department:
Administrative wages and salaries
Office equipment depreciation .....
Administrative building lease .......
15%
30%
0%
5%
0%
0%
10%
0%
0%
30%
25%
0%
40% 100%
45% 100%
100% 100%
Marketing Department:
Marketing wages and salaries ......
Selling expenses .........................
22%
10%
8%
0%
0%
0%
60%
70%
10% 100%
20% 100%
100%
100%
100%
100%
© The McGraw-Hill Companies, Inc., 2012. All rights reserved.
TM 7-9
THE CLASSIC BRASS EXAMPLE (continued)
Exhibit 7-5
First-Stage Allocations to Activity Cost Pools
Activity Cost Pools
Customer Product
Customer
Orders
Design Order Size Relations
Production Department:
Indirect factory wages.................
Factory equipment depreciation ...
Factory utilities ...........................
Factory building lease .................
General Administrative Department:
Administrative wages and salaries
Office equipment depreciation .....
Administrative building lease .......
Marketing Department:
Marketing wages and salaries ......
Selling expenses .........................
TTotal ..........................................
$125,000 $200,000
60,000
0
0
12,000
0
0
Other
Total
$100,000
180,000
60,000
0
$50,000
0
0
0
$25,000
60,000
48,000
80,000
$500,000
300,000
120,000
80,000
20,000
0
0
40,000
0
0
120,000
12,500
0
160,000
22,500
60,000
400,000
50,000
60,000
55,000
20,000
5,000
0
$320,000 $252,000
0
0
$380,000
150,000
35,000
$367,500
60,000
15,000
0
25,000
250,000
10,000
50,000
$490,500 $1,810,000
© The McGraw-Hill Companies, Inc., 2012. All rights reserved.
TM 7-10
THE CLASSIC BRASS EXAMPLE (continued)
Exhibit 7-6
Computation of Activity Rates
Activity Cost Pools
Customer orders ......
Product design ........
Order size ...............
Customer relations...
Other ......................
(a)
Total Cost
(b)
Total Activity
(a) ÷ (b)
Activity Rate
$320,000 1,000 orders
$320 per order
$252,000
400 designs
$630 per design
$380,000 20,000 MHs
$19 per MH
$367,500
250 customers $1,470 per customer
Not applicable
$490,500 Not applicable
-
© The McGraw-Hill Companies, Inc., 2012. All rights reserved.
TM 7-11
THE CLASSIC BRASS EXAMPLE (continued)
Easy to get lost in these numbers so skip to TM 7-16 here
Standard Stanchions
1.
This product does not require any new design resources.
2.
Thirty thousand units were ordered during the year, comprising 600
separate orders.
3.
Each stanchion requires 35 minutes of machine time for a total of
17,500 machine-hours.
Custom Compass Housings
1.
This is a custom product that requires new design resources.
2.
There were 400 orders for custom compass housings. Orders for this
product are placed separately from orders for standard stanchions.
3.
There were 400 custom designs prepared. One custom design was
prepared for each order.
4.
Because some orders were for more than one unit, a total of 1,250
custom compass housings were produced during the year. A custom
compass housing requires an average of 2 machine-hours for a total of
2,500 machine-hours.
Standard
Stanchions
Sales
Direct costs:
Direct materials .........
Direct labor................
Shipping ....................
$2,660,000
$905,500
$263,750
$60,000
Custom
Compass
Housings
Total
$540,000 $3,200,000
$69,500
$87,500
$5,000
$975,000
$351,250
$65,000
© The McGraw-Hill Companies, Inc., 2012. All rights reserved.
TM 7-12
THE CLASSIC BRASS EXAMPLE (continued)
Exhibit 7-8
Assigning Overhead Costs to Products
Activity Cost Pools
(a)
Activity Rate
(b)
Activity
Standard Stanchions
Customer orders ....................
Product design ......................
Order size .............................
Total .....................................
$320 per order
$630 per design
$19 per MH
600 orders
0 designs
17,500 MHs
$192,000
0
332,500
$524,500
$320 per order
$630 per design
$19 per MH
400 orders
400 designs
2,500 MHs
$128,000
252,000
47,500
$427,500
Custom Compass Housings
Customer orders ....................
Product design ......................
Order size .............................
Total .....................................
(a) × (b)
ABC Cost
© The McGraw-Hill Companies, Inc., 2012. All rights reserved.
TM 7-13
THE CLASSIC BRASS EXAMPLE (continued)
Exhibit 7-10
Product Margins—Activity-Based Costing
Standard Stanchions
Sales.................................................
Costs:
Direct materials ..............................
Direct labor ....................................
Shipping .........................................
Customer orders (from Exhibit 7-8) ..
Product design (from Exhibit 7-8) ....
Order size (from Exhibit 7-8) ...........
Total cost ..........................................
Product margin ..................................
Custom Compass
Housings
$2,660,000
$905,500
263,750
60,000
192,000
0
332,500
$540,000
$ 69,500
87,500
5,000
128,000
252,000
47,500
1,753,750
$ 906,250
589,500
$(49,500)
© The McGraw-Hill Companies, Inc., 2012. All rights reserved.
TM 7-14
THE CLASSIC BRASS EXAMPLE (continued)
Exhibit 7-9
Assigning Overhead Costs to Customers
Overhead Cost for Windward Yachts
(a)
Activity Cost Pools
Activity Rate
Customer orders ..........
$320
Product design ............
$630
Order size ...................
$19
Customer relations....... $1,470
Total ...........................
per
per
per
per
order
design
MH
customer
(b)
Activity
3
1
177
1
(a) × (b)
ABC Cost
orders
designs
MHs
customer
$ 960
630
3,363
1,470
$6,423
Exhibit 7-11
Customer Margin—Activity-Based Costing
Customer Margin for Windward Yachts
Sales (given) .............................................
Costs:
Direct materials (given) ............................
Direct labor (given) ..................................
Shipping costs (given) ..............................
Customer orders (from Exhibit 7-9)...........
Product design (from Exhibit 7-9) .............
Order size (from Exhibit 7-9) ....................
Customer relations (from Exhibit 7-9) .......
Customer margin .......................................
$11,350
$2,123
1,900
205
960
630
3,363
1,470
10,651
$ 699
© The McGraw-Hill Companies, Inc., 2012. All rights reserved.
TM 7-15
THE CLASSIC BRASS EXAMPLE (continued)
Exhibit 7-12
Product Margins—Traditional Costing System
Custom
Compass Housing
Standard Stanchions
Sales (given) .....................
Cost:
Direct materials (given) ...
Direct labor (given) .........
Manufacturing overhead
(see below) ..................
Product margin..................
Selling and administrative
expense (given) ...........
Net operating income ........
$2,660,000
$905,500
263,750
875,000
$540,000
$ 69,500
87,500
2,044,250
$ 615,750
Total
125,000
$3,200,000
$ 975,000
351,250
282,000
$258,000
1,000,000
2,326,250
873,750
875,000
$( 1,250)
Predetermined manufacturing = Total estimated manufacturing overhead
overhead rate
Total estimated machine-hours
=
$1,000,000
= $50 per machine-hour
20,000 machine-hours
The standard stanchions require 17,500 machine-hours and the custom compass housings require 2,500
machine-hours. Therefore, $875,000 (= 17,500 machine-hours × $50 per machine-hour) of
manufacturing overhead would be charged to the standard stanchions and $125,000 (= 2,500 machinehours × $50 per machine-hour) to the custom compass housing.
© The McGraw-Hill Companies, Inc., 2012. All rights reserved.
TM 7-16
CONTRASTING ACTIVITY-BASED COSTING AND TRADITIONAL COSTING
© The McGraw-Hill Companies, Inc., 2012. All rights reserved.
TM 7-17
TYPICAL IMPACT ON PRODUCT COSTS
FROM IMPLEMENTING ABC
• Adopting activity-based costing usually results in shifting manufacturing
overhead costs from high-volume products (e.g., stanchions) to lowvolume products (e.g., custom compass housings).
• The cost per unit of the low-volume products increases and the cost per
unit of the high-volume products decreases because of better
assignment of batch-level and product-level costs.
• The effects are not symmetrical—the dollar effect on the cost per unit of
the low-volume products is usually larger.
Note: The product costs from the activity-based costing system described
here would not be acceptable for external financial reports.
• Excludes some manufacturing costs (i.e., costs of idle capacity and
organization-sustaining costs)
• Includes some nonmanufacturing costs.
• Relies on subjective interview data.
© The McGraw-Hill Companies, Inc., 2012. All rights reserved.

