Blood Pressure Lab
advertisement
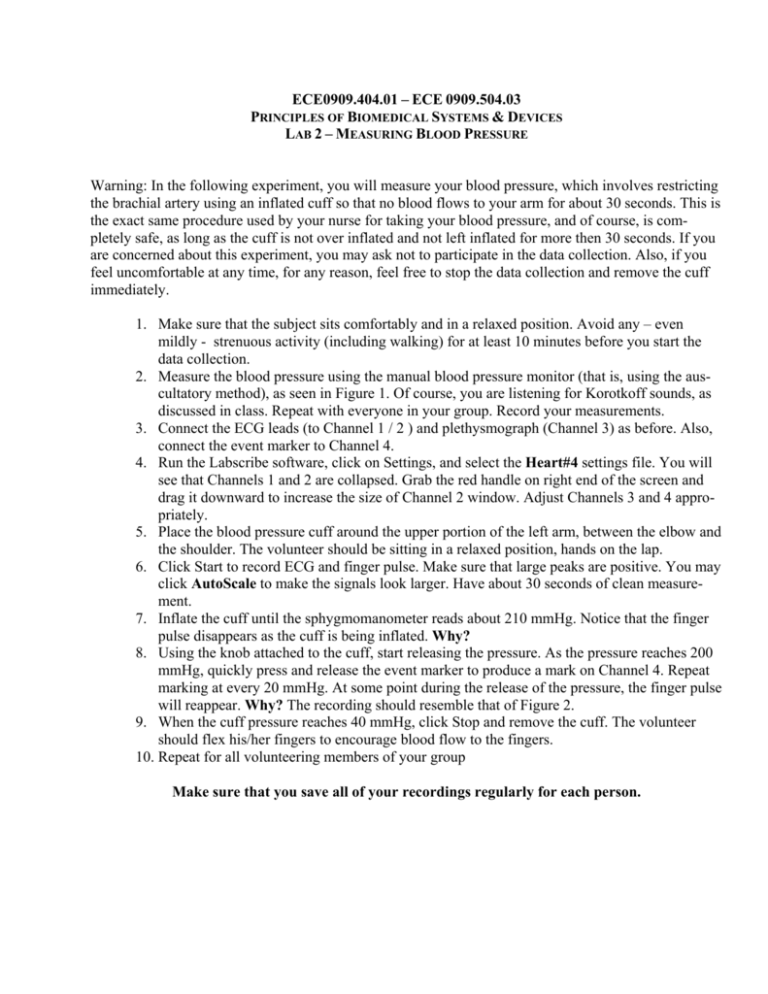
ECE0909.404.01 – ECE 0909.504.03 PRINCIPLES OF BIOMEDICAL SYSTEMS & DEVICES LAB 2 – MEASURING BLOOD PRESSURE Warning: In the following experiment, you will measure your blood pressure, which involves restricting the brachial artery using an inflated cuff so that no blood flows to your arm for about 30 seconds. This is the exact same procedure used by your nurse for taking your blood pressure, and of course, is completely safe, as long as the cuff is not over inflated and not left inflated for more then 30 seconds. If you are concerned about this experiment, you may ask not to participate in the data collection. Also, if you feel uncomfortable at any time, for any reason, feel free to stop the data collection and remove the cuff immediately. 1. Make sure that the subject sits comfortably and in a relaxed position. Avoid any – even mildly - strenuous activity (including walking) for at least 10 minutes before you start the data collection. 2. Measure the blood pressure using the manual blood pressure monitor (that is, using the auscultatory method), as seen in Figure 1. Of course, you are listening for Korotkoff sounds, as discussed in class. Repeat with everyone in your group. Record your measurements. 3. Connect the ECG leads (to Channel 1 / 2 ) and plethysmograph (Channel 3) as before. Also, connect the event marker to Channel 4. 4. Run the Labscribe software, click on Settings, and select the Heart#4 settings file. You will see that Channels 1 and 2 are collapsed. Grab the red handle on right end of the screen and drag it downward to increase the size of Channel 2 window. Adjust Channels 3 and 4 appropriately. 5. Place the blood pressure cuff around the upper portion of the left arm, between the elbow and the shoulder. The volunteer should be sitting in a relaxed position, hands on the lap. 6. Click Start to record ECG and finger pulse. Make sure that large peaks are positive. You may click AutoScale to make the signals look larger. Have about 30 seconds of clean measurement. 7. Inflate the cuff until the sphygmomanometer reads about 210 mmHg. Notice that the finger pulse disappears as the cuff is being inflated. Why? 8. Using the knob attached to the cuff, start releasing the pressure. As the pressure reaches 200 mmHg, quickly press and release the event marker to produce a mark on Channel 4. Repeat marking at every 20 mmHg. At some point during the release of the pressure, the finger pulse will reappear. Why? The recording should resemble that of Figure 2. 9. When the cuff pressure reaches 40 mmHg, click Stop and remove the cuff. The volunteer should flex his/her fingers to encourage blood flow to the fingers. 10. Repeat for all volunteering members of your group Make sure that you save all of your recordings regularly for each person. Brachial artery Figure 1. Auscultatory technique for measuring blood pressure (from Webster). ECG recording Noise due to electrode movement. Your recording should not show this noise, if you sit still during the recording. Blood pressure / flow Event markers @ every 20mmHg 200 mmHg 80 mmHg Figure 2. Analysis window following the blood pressure experiment Data Analysis and Questions (to be answered in your lab report) The recording you have obtained from the pulse plethysmograph is not exactly the blood pressure, but rather a measure of blood flow. This recording can be used, however to obtain both the systolic and the diastolic pressure. Exactly, how that is done, is your job to find out, however, the following measurements should direct you in the right direction. 1. Find the section in finger pulse, where the pulse wave starts reappearing, as the pressure is being released. This should be around 120 mmHg (+/- 25 mmHg). Use the cursors to select the region that includes the first (small) pulse and the closest event marker on each side of the pulse. Click the analysis window to zoom into this region. 2. Place one cursor on the peak of the smallest (first) peak (after the release) and the second cursor on the event mark after this peak. Measure the time interval between these two peaks, and let’s call this value Time1. 3. Leave the first cursor on the first peak, and move the second cursor to the event mark right before the first peak. Measure the time interval between these two cursors, and call this Time2. 4. Calculate (Time1/Time2)*20. What does this number represent? 5. Using the number you calculated in step 4, as well as the actual pressure values that each event mark correspond to, calculate the systolic pressure. 6. As more and more pressure is released from the cuff, the amplitude of the flow pulse increases and reaches its maximum value. The pressure where the peak reaches this maximum value is the diastolic pressure, typically around 80 mmHg (+/- 20 mmHg). Using a similar procedure as outlined above, can you find the diastolic pressure? 7. Obtain your blood pressure (systolic and diastolic) and heart rate using the automated blood pressure monitor (ABM) to be given to you during your experiment. Compare the results you have obtained to those given by the ABM as well as the manual measurement. How different are the results? What possible reasons can you give for the differences? 8. Given the ECG and the blood flow signal you collected, determine how you can calculate the blood flow speed (say, in cm/s)? Calculate this number from your measurements. 9. Bonus: Collect and collate all the data obtained by all students in this class and perform a statistical test on whether the students in this class have an above normal blood pressure for systolic and diastolic blood pressures. What confidence interval can you give? For the purposes of this experiment, assume normal is below 120 for systolic and below 80 for diastolic.
