Motion and potential energy graphs
advertisement

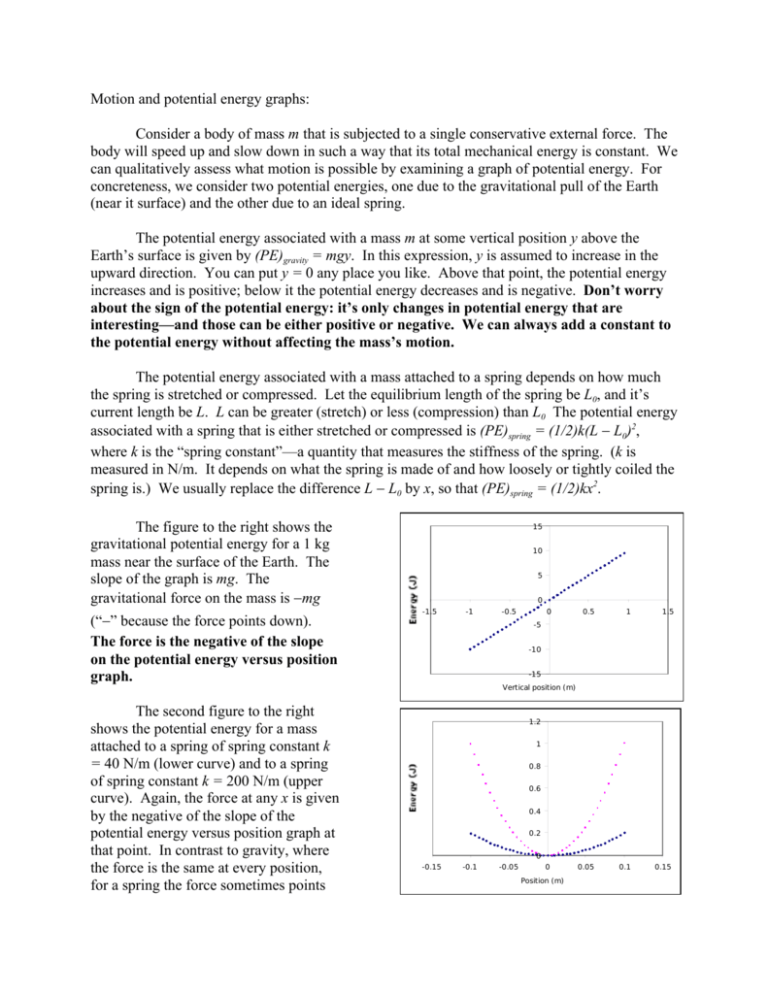
Motion and potential energy graphs: Consider a body of mass m that is subjected to a single conservative external force. The body will speed up and slow down in such a way that its total mechanical energy is constant. We can qualitatively assess what motion is possible by examining a graph of potential energy. For concreteness, we consider two potential energies, one due to the gravitational pull of the Earth (near it surface) and the other due to an ideal spring. The potential energy associated with a mass m at some vertical position y above the Earth’s surface is given by (PE)gravity = mgy. In this expression, y is assumed to increase in the upward direction. You can put y = 0 any place you like. Above that point, the potential energy increases and is positive; below it the potential energy decreases and is negative. Don’t worry about the sign of the potential energy: it’s only changes in potential energy that are interesting—and those can be either positive or negative. We can always add a constant to the potential energy without affecting the mass’s motion. The potential energy associated with a mass attached to a spring depends on how much the spring is stretched or compressed. Let the equilibrium length of the spring be L0, and it’s current length be L. L can be greater (stretch) or less (compression) than L0 The potential energy associated with a spring that is either stretched or compressed is (PE)spring = (1/2)k(L − L0)2, where k is the “spring constant”—a quantity that measures the stiffness of the spring. (k is measured in N/m. It depends on what the spring is made of and how loosely or tightly coiled the spring is.) We usually replace the difference L − L0 by x, so that (PE)spring = (1/2)kx2. The figure to the right shows the gravitational potential energy for a 1 kg mass near the surface of the Earth. The slope of the graph is mg. The gravitational force on the mass is −mg (“−” because the force points down). The force is the negative of the slope on the potential energy versus position graph. The second figure to the right shows the potential energy for a mass attached to a spring of spring constant k = 40 N/m (lower curve) and to a spring of spring constant k = 200 N/m (upper curve). Again, the force at any x is given by the negative of the slope of the potential energy versus position graph at that point. In contrast to gravity, where the force is the same at every position, for a spring the force sometimes points 15 10 5 0 -1.5 -1 -0.5 0 0.5 1 0.05 0.1 1.5 -5 -10 -15 Vertical position (m) 1.2 1 0.8 0.6 0.4 0.2 0 -0.15 -0.1 -0.05 0 Position (m) 0.15 to the right (for negative values of x—compressions) and sometimes to the left (for positive values of x—stretches). The magnitude of the force is zero when x = 0 (no compression or stretch) and grows as the magnitude of x grows. Let’s try to deduce what motion 15 the gravitational potential energy 10 permits from a ME = 7.5 J graph of potential 5 energy. Start with gravity. Suppose C 0 we place a 1 kg B -1.5 -1 -0.5 0 0.5 A 1 1.5 mass 0.75 m above -5 the height that has been selected as y = 0. That’s point A -10 on the figure to the right. If we let go, -15 the mass initially Position (m) has zero kinetic energy, +7.5 J of potential energy, and +7.5 J of mechanical energy (recall: ME = KE + PE). At A there is a force acting (the slope of the PE curve is not zero at A) and the mass will accelerate in the direction of the force. As long as there are no other forces, the mass’s PE will decrease as it falls and its KE will increase. At point B (y = +0.25 m), for example, the mass’s PE will have dropped to +2.5 J and its KE must have increased to 5.0 J (so that KE + PE = +7.5 J). If the mass can fall below the y = 0 mark (don’t be prejudiced: y = 0 doesn’t have to be at the surface of the Earth, it can be anywhere), the PE goes negative. At C (y = −0.5 m), for example, the PE equals –5 J, so the KE must equal 12.5 J (that is, 12.5 J + (−5 J) = +7.5 J). Until the Earth gets in the way (not pictured) the mass continues to lose PE and gain KE. Now, let’s see how motion works for a mass attached to a spring. A mass-spring potential energy is pictured below for a value of k = 200 N/m. We start by stretching the spring by 0.07 m (point A). If the mass is released from rest it has a total mechanical energy of +0.49 J. At A, the potential energy has a positive slope so the mass will experience a force in the negative direction. It accelerates, and as it does so it gains KE and loses PE. At point B (x = +0.05 m), the mass’s PE is +0.25 J and its KE must be 0.24 J. As the mass passes through x = 0 (the position of no stretch) it experiences instantaneously no force (the PE slope is zero there) but it is moving with a KE of 0.49 J. It continues past x = 0 and begins to compress the spring, slowing down as it does so. Finally, at x = −0.07 m (C) the mass has lost all of its KE and the PE is back to +0.49 J. At that instant the mass is at rest, but it feels a force pushing to the right (the PE slope is negative, so the force points in the positive direction), so it begins to accelerate to the right. Eventually the mass gets to x = +0.07 m again and the whole process repeats over and over. (Remember, we are assuming no friction.) 1.2 1 0.8 0.6 B ME = 0.49 J 0.4 0.2 -0.15 -0.1 C 0 -0.05 0 Position (m) 0.05 A 0.1 0.15


