How the quantity of money is measured The money multiplier
advertisement
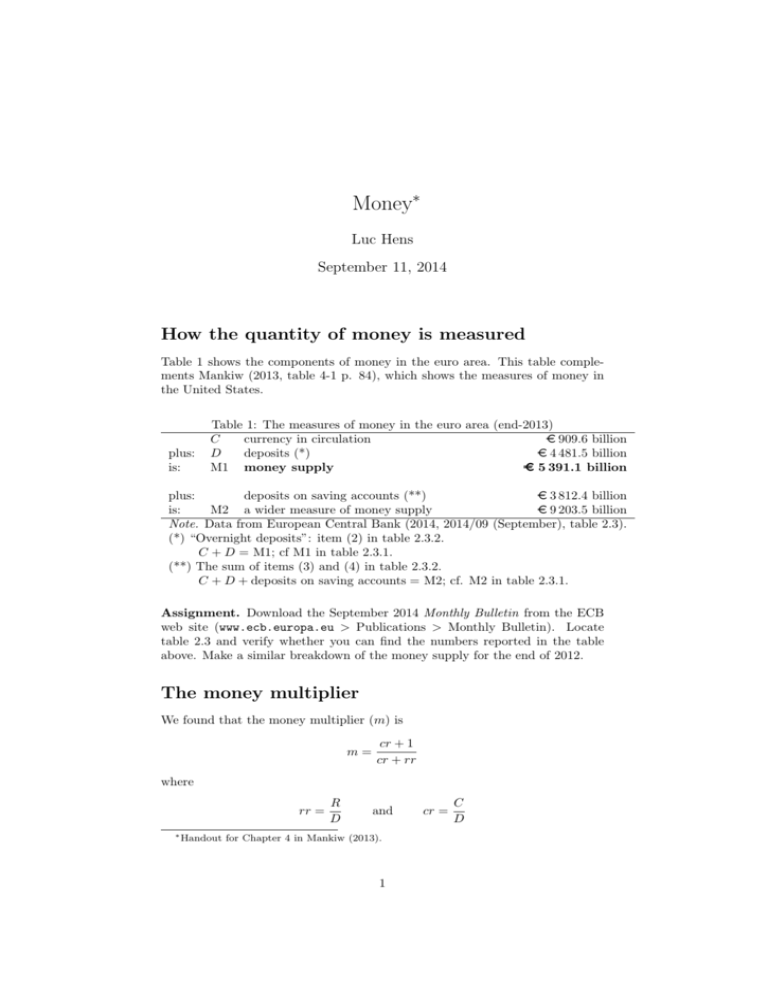
Money∗ Luc Hens September 11, 2014 How the quantity of money is measured Table 1 shows the components of money in the euro area. This table complements Mankiw (2013, table 4-1 p. 84), which shows the measures of money in the United States. plus: is: Table 1: The measures of money in the euro area (end-2013) C currency in circulation € 909.6 billion D deposits (*) € 4 481.5 billion M1 money supply € 5 391.1 billion plus: deposits on saving accounts (**) € 3 812.4 billion is: M2 a wider measure of money supply € 9 203.5 billion Note. Data from European Central Bank (2014, 2014/09 (September), table 2.3). (*) “Overnight deposits”: item (2) in table 2.3.2. C + D = M1; cf M1 in table 2.3.1. (**) The sum of items (3) and (4) in table 2.3.2. C + D + deposits on saving accounts = M2; cf. M2 in table 2.3.1. Assignment. Download the September 2014 Monthly Bulletin from the ECB web site (www.ecb.europa.eu > Publications > Monthly Bulletin). Locate table 2.3 and verify whether you can find the numbers reported in the table above. Make a similar breakdown of the money supply for the end of 2012. The money multiplier We found that the money multiplier (m) is m= cr + 1 cr + rr where rr = ∗ Handout R D and for Chapter 4 in Mankiw (2013). 1 cr = C D Currency in circulation (C) and deposits (D) are listed in table 1. Reserves (R) are reported as “Credit institutions’ current accounts” in European Central Bank (2014, table 1.4.2 p. S9, Reserve maintenance). End-2013 the reserves of banks in the euro area amounted to 220.2 billion euros. This implies that the reserve ratio (rr) in the euro area (end-2012) is: rr = R 220.2 billion euros = ≈ 0.05 D 4481.5 billion euros The currency-to-deposits ratio (cr) in the euro area (end-2012) is: cr = 909.6 billion euros C = ≈ 0.20 D 4481.5 billion euros Hence the money multiplier in the euro area is m= cr + 1 0.20 + 1 ≈ ≈ 4.8 cr + rr 0.20 + 0.05 Instruments of monetary policy Open market operations. The European Central Bank didn’t use open market operations in the traditional sense before 2009. Since mid-2009 however, the European Central Bank has purchased (and at times sold) government bonds to influence the money supply. These purchases and sales of government bonds by the central bank work just like open market transactions in our textbook model of the money multiplier. The ECB’s holdings of such securities appear in the ECB balance sheet as “securities held for monetary policy purposes” (see a recent issue of European Central Bank (2014, Monetary Policy Statistics: table 1.1)). Figure 1 shows the ECB’s holdings of securities held for monetary policy purposes. Note the sharp increase in the ECB’s holdings of securities in the second half of 2011: this represents purchases by the ECB of government bonds and hence causes the money supply to increase. Assignment. Download the September 2014 Monthly Bulletin from the ECB web site (www.ecb.europa.eu > Publications > Monthly Bulletin). Locate table 1.1 and find the line “securities held for monetary policy purposes”. Verify whether the numbers match figure 1. Did the ECB’s bond holdings go up or down in the weeks covered by the table? Does that imply an increase or a decrease of the money supply? Policy rate. The main policy rate of the European Central Bank is the “interest rate on main refinancing operations”, or refi rate. The refi rate is reported in European Central Bank (2014, table 1.2) and on the web site of the European Central Bank (www.ecb.europa.eu; follow the link > Past key ECB interest rates). Figure 2 shows the refi rate since 1999. If the European Central Bank changes the refi rate, it does this by multiples of one-quarter of a percentage point (25 basis points). Minimum reserve requirements. The European Central Bank changed the minimum reserve requirements only once (from 2% to 1% in January 2012). The central banks of (among other countries) China and India change the minimum reserve requirements frequently as a tool of monetary policy. Figure 3 shows the 2 250 Billions of euro 200 150 100 50 0 2009 2010 2011 2012 2013 2014 2015 Figure 1: Government bonds held by the European Central Bank for monetary policy purposes. Note. Data from European Central Bank (2014, Monetary Policy Statistics: table 1.1), various issues. 5 4 Percent 3 2 1 0 1999 2001 2003 2005 2007 2009 2011 2013 2015 Figure 2: Refi rate of the European Central Bank, 1999–2014. Note. Data from European Central Bank (2014, table 1.2), various issues. 3 22 21 Percent 20 19 18 17 16 15 2009 2010 2011 2012 2013 2014 2015 Figure 3: Minimum reserve ratio required from large banks by the central bank of China. Note. Data from People’s Bank of China (2014) and previous issues. minimum reserve reserve ratio required from large banks by the central bank of China. References European Central Bank (2014). Monthly Bulletin. European Central Bank, Frankfurt. Mankiw, N. G. (2013). Macroeconomics. Worth/Palgrave MacMillan, Basingstoke, 8th edition. People’s Bank of China (2014). Highlights of China’s Monetary Policy in the Second Quarter of 2014. Retrieved on 11 September 2014 from http://www.pbc.gov.cn/publish/english/955/index.html. 4
