what does our pie chart mean?
advertisement
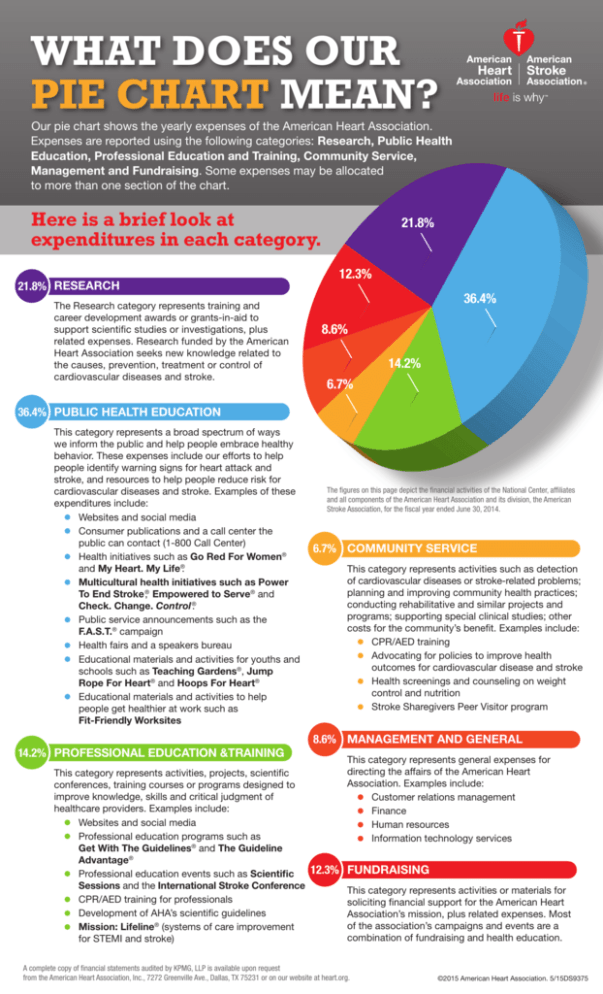
WHAT DOES OUR PIE CHART MEAN? Our pie chart shows the yearly expenses of the American Heart Association. Expenses are reported using the following categories: Research, Public Health Education, Professional Education and Training, Community Service, Management and Fundraising. Some expenses may be allocated to more than one section of the chart. Here is a brief look at expenditures in each category. 21.8% RESEARCH The Research category represents training and career development awards or grants-in-aid to support scientific studies or investigations, plus related expenses. Research funded by the American Heart Association seeks new knowledge related to the causes, prevention, treatment or control of cardiovascular diseases and stroke. 21.8% 12.3% 36.4% 8.6% 14.2% 6.7% 36.4% PUBLIC HEALTH EDUCATION This category represents a broad spectrum of ways we inform the public and help people embrace healthy behavior. These expenses include our efforts to help people identify warning signs for heart attack and stroke, and resources to help people reduce risk for cardiovascular diseases and stroke. Examples of these expenditures include: • Websites and social media • Consumer publications and a call center the public can contact (1-800 Call Center) • Health initiatives such as Go Red For Women® and My Heart. My Life®. • Multicultural health initiatives such as Power To End Stroke ®, Empowered to Serve® and Check. Change. Control ®. • Public service announcements such as the F.A.S.T.® campaign • Health fairs and a speakers bureau • Educational materials and activities for youths and schools such as Teaching Gardens®, Jump Rope For Heart® and Hoops For Heart® • Educational materials and activities to help people get healthier at work such as Fit-Friendly Worksites 14.2% PROFESSIONAL EDUCATION &TRAINING This category represents activities, projects, scientific conferences, training courses or programs designed to improve knowledge, skills and critical judgment of healthcare providers. Examples include: • Websites and social media • Professional education programs such as Get With The Guidelines® and The Guideline Advantage® • Professional education events such as Scientific Sessions and the International Stroke Conference • CPR/AED training for professionals • Development of AHA’s scientific guidelines • Mission: Lifeline® (systems of care improvement for STEMI and stroke) The figures on this page depict the financial activities of the National Center, affiliates and all components of the American Heart Association and its division, the American Stroke Association, for the fiscal year ended June 30, 2014. 6.7% COMMUNITY SERVICE This category represents activities such as detection of cardiovascular diseases or stroke-related problems; planning and improving community health practices; conducting rehabilitative and similar projects and programs; supporting special clinical studies; other costs for the community’s benefit. Examples include: • CPR/AED training • Advocating for policies to improve health outcomes for cardiovascular disease and stroke • Health screenings and counseling on weight control and nutrition • Stroke Sharegivers Peer Visitor program 8.6% MANAGEMENT AND GENERAL This category represents general expenses for directing the affairs of the American Heart Association. Examples include: • Customer relations management • Finance • Human resources • Information technology services 12.3% FUNDRAISING This category represents activities or materials for soliciting financial support for the American Heart Association’s mission, plus related expenses. Most of the association’s campaigns and events are a combination of fundraising and health education. A complete copy of financial statements audited by KPMG, LLP is available upon request from the American Heart Association, Inc., 7272 Greenville Ave., Dallas, TX 75231 or on our website at heart.org. ©2015 American Heart Association. 5/15DS9375
