HR LEADERSHIP COUNCIL®
CORPORATE
LEADERSHIP
COUNCIL
HRLC’s Employee Engagement Survey
Get an accurate view of engagement at your organization
by measuring employee perceptions of past events,
present experiences, and future expectations.
Address a Critical Need
Employee engagement builds
competitive advantage when
managed strategically. Companies
that build employee engagement
are 16% more likely to achieve
profit goals and 13% more likely to
achieve revenue goals.
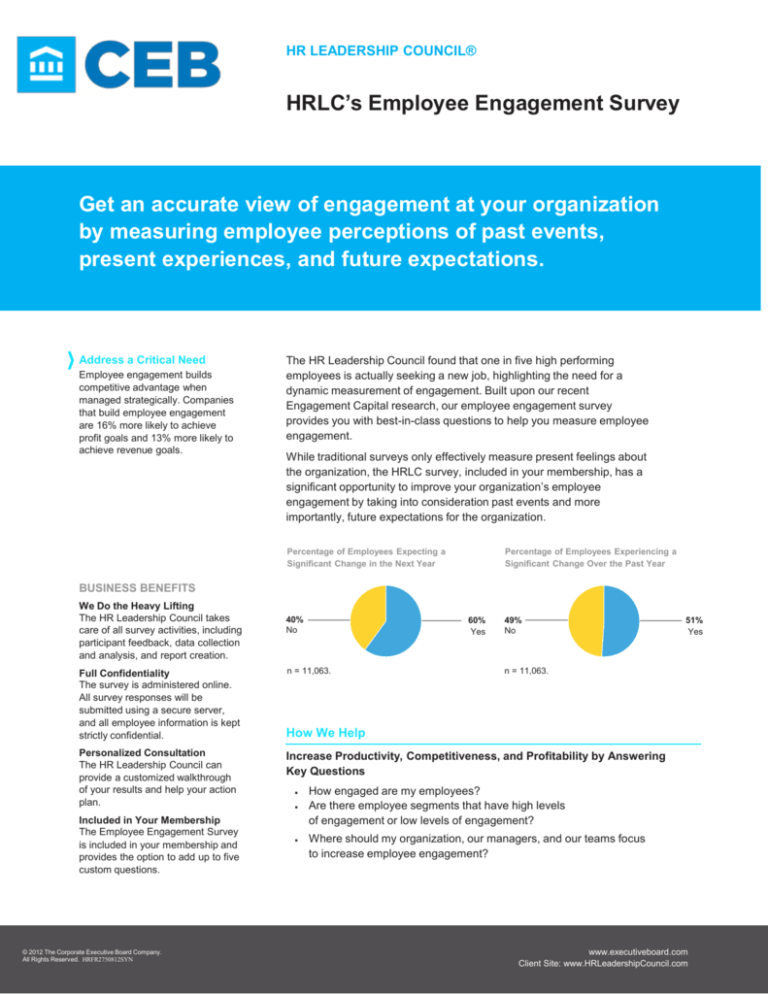
The HR Leadership Council found that one in five high performing
employees is actually seeking a new job, highlighting the need for a
dynamic measurement of engagement. Built upon our recent
Engagement Capital research, our employee engagement survey
provides you with best-in-class questions to help you measure employee
engagement.
While traditional surveys only effectively measure present feelings about
the organization, the HRLC survey, included in your membership, has a
significant opportunity to improve your organization’s employee
engagement by taking into consideration past events and more
importantly, future expectations for the organization.
Percentage of Employees Expecting a
Significant Change in the Next Year
Percentage of Employees Experiencing a
Significant Change Over the Past Year
BUSINESS BENEFITS
We Do the Heavy Lifting
The HR Leadership Council takes
care of all survey activities, including
participant feedback, data collection
and analysis, and report creation.
Full Confidentiality
The survey is administered online.
All survey responses will be
submitted using a secure server,
and all employee information is kept
strictly confidential.
Personalized Consultation
The HR Leadership Council can
provide a customized walkthrough
of your results and help your action
plan.
Included in Your Membership
The Employee Engagement Survey
is included in your membership and
provides the option to add up to five
custom questions.
© 2012 The Corporate Executive Board Company.
All Rights Reserved. HRFR2750812SYN
40%
No
60%
Yes
n = 11,063.
49%
No
51%
Yes
n = 11,063.
How We Help
Increase Productivity, Competitiveness, and Profitability by Answering
Key Questions
■
■
■
How engaged are my employees?
Are there employee segments that have high levels
of engagement or low levels of engagement?
Where should my organization, our managers, and our teams focus
to increase employee engagement?
www.executiveboard.com
Client Site: www.HRLeadershipCouncil.com
HR LEADERSHIP COUNCIL®
CORPORATE
LEADERSHIP
COUNCIL
PARTICIPATING MEMBERS
HRLC’s Employee Engagement Survey
Participating members will receive customized analysis designed to
implement an actionable plan.
Features
■
■
Online survey available to deploy to current employees
Standard survey includes 22 HRLC-tested questions with
benchmarked analysis
■
Option to add up to five custom questions
■
Customization and language capabilities available for a small fee
■
■
Customizable Powerpoint presentation and Excel workbook available
three weeks after survey close
HRLC phone-based consultation to identify areas for focus and action
plan
Custom Analysis
■
Understand your organization’s overall employee engagement levels
■
Identify key strengths and opportunities by employee segments
■
Build an action plan to address opportunities for improvement using
HRLC resources
Sample Report
Execu&ve Summary
HRLC Employee Engagement
Overview of Engagement Capital at Alpha Company
Employee Engagement Metrics
Engagement Capital Score
“I congratulate HRLC for
such a clean and easy-tocomplete survey.
The Engagement Capital score is the average of the Engagement Capital BastE
BresentE and Cuture Fues&ons. This metric is designed to give you an overal
l score of the amount of commitmentE discre&onary eGortE and intent to sta
y that employees exhibit.
Percent Favorable
Overall Score
Alpha Company
Benchmark
Engagement Capital
64% (n=3,700)
63% (n=3,965)
Top Engagement Gaps
The Top Engagement Gaps refers to your two lowest engagement scores.
Engagement Metric
Compensation & Rewards*
There was none of the
other clutter in it that we
see in many other surveys!
The instructions are clear
and easy to
Communication*
38% (n=826)
Difference From B
enchmark
‐2%
44% (n=1,196)
3%
Alpha Company
The index metrics below allow you to iden&fy areas of strength and areas for i
mprovement across the en&re organi@a&on. Bercent Cavorable in this report
refers to the percentage of employees who scored primarily sixes or sevens.
Percent Favorable
Engagement Metric
Alpha Company
Benchmark
Engagement Capital (Past)
65% (n=3,700)
64% (n=3,965)
Engagement Capital (Present)
69% (n=3,700)
70% (n=3,965)
Engagement Capital (Future)
57% (n=3,700)
54% (n=3,965)
Discretionary Effort
88% (n=3,699)
88% (n=5,170)
Intent to Stay
72% (n=3,699)
72% (n=5,170)
Employee Commitment*
75% (n=1,196)
74% (n=2,756)
Culture/Values*
58% (n=1,037)
65% (n=3,806)
52% (n=826)
51% (n=3,758)
55% (n=1,937)
55% (n=3,817)
Work Environment*
Manager*
Compensation & Rewards*
The Top Engagement Strengths refers to your two highest engagement s
cores.
Engagement Metric
Discretionary Effort
Benefits*
88% (n=3,699)
Difference From B
enchmark
0%
77% (n=195)
n.a.
Alpha Company
HRLC Employee Engagement
Culture/Values Deep‐Dives
Career/Performance*
Top Engagement Strengths
Employee Engagement Deep‐Dives
55% (n=1,196)
38% (n=826)
53% (n=3,591)
T7e 89es:ons ;it7in t7is sec:on meas9re employees> percep:ons o? 7o; ;ell t7e organi@a:on 7as estaAlis7ed corporate val9es and ;7et7er or not t7e organi@a:on lives 9p to
t7ose val9esC D? 9:li@ed eEec:velyF val9es can 7ave 9p to a G3I impact on engagement capitalC
1 2elieve i3 45 6r7a3i8a963:s values;
I believe in my organization’s values.
Frequency Distribution
3%
3%
0%
Communication*
44% (n=1,196)
41% (n=2,334)
49% (n=1,196)
49% (n=2,520)
Benefits*
77% (n=195)
Safety Environment*
59% (n=826)
n.a.
Customer Service*
67% (n=826)
72% (n=1,950)
26%
20%
Average
2012
Count
2012
5.7
3,699
5.7
5,170
Average
2012
Count
2012
5.4
1,037
n.a.
n.a.
71%
40%
60%
Top 2 score
Middle 3 score
70%
Benchmark
40% (n=4,295)
Leadership*
28%
Alpha Company
80%
LoMom 2 score
100%
n.a.
* Denotes that responses from optional modules were included in the Alpha Company
<5 6r7a3i8a963:s values =ave 2ee3 >learl5 >644u3i>ate?;
My organization’s values have been clearly communicated.
Frequency Distribution
score. Optional modules scores are not used in the benchmark.
5%
35%
60%
Alpha Company
0%
Benchmark
0%
20%
40%
60%
80%
100%
understand.”
HR Manager,
Utilities Industry
© 2012 The Corporate Executive Board Company.
All Rights Reserved. HRFR2750812SYN
Please contact your Account Director for additional information.
www.executiveboard.com
Client Site: www.HRLeadershipCouncil.com


