MIE 373 Umass J.M. Smith Fall 2007 Homework #3 1. Consider the
advertisement
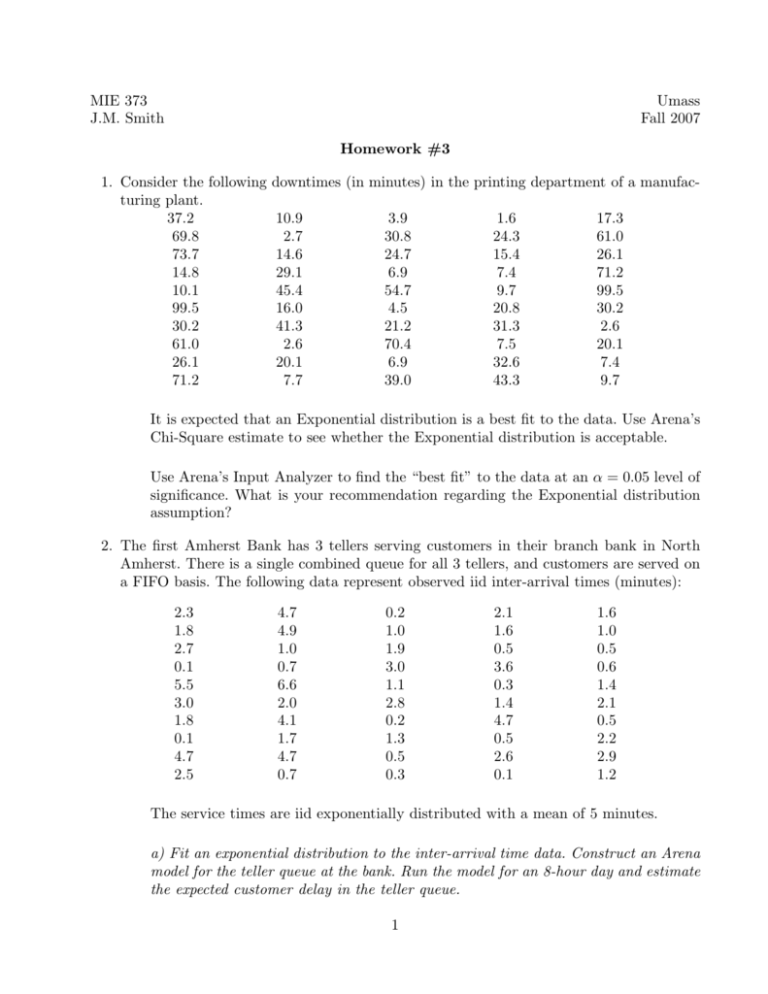
MIE 373 J.M. Smith Umass Fall 2007 Homework #3 1. Consider the following downtimes (in minutes) in the printing department of a manufacturing plant. 37.2 10.9 3.9 1.6 17.3 69.8 2.7 30.8 24.3 61.0 73.7 14.6 24.7 15.4 26.1 14.8 29.1 6.9 7.4 71.2 10.1 45.4 54.7 9.7 99.5 99.5 16.0 4.5 20.8 30.2 30.2 41.3 21.2 31.3 2.6 61.0 2.6 70.4 7.5 20.1 26.1 20.1 6.9 32.6 7.4 71.2 7.7 39.0 43.3 9.7 It is expected that an Exponential distribution is a best fit to the data. Use Arena’s Chi-Square estimate to see whether the Exponential distribution is acceptable. Use Arena’s Input Analyzer to find the “best fit” to the data at an α = 0.05 level of significance. What is your recommendation regarding the Exponential distribution assumption? 2. The first Amherst Bank has 3 tellers serving customers in their branch bank in North Amherst. There is a single combined queue for all 3 tellers, and customers are served on a FIFO basis. The following data represent observed iid inter-arrival times (minutes): 2.3 1.8 2.7 0.1 5.5 3.0 1.8 0.1 4.7 2.5 4.7 4.9 1.0 0.7 6.6 2.0 4.1 1.7 4.7 0.7 0.2 1.0 1.9 3.0 1.1 2.8 0.2 1.3 0.5 0.3 2.1 1.6 0.5 3.6 0.3 1.4 4.7 0.5 2.6 0.1 1.6 1.0 0.5 0.6 1.4 2.1 0.5 2.2 2.9 1.2 The service times are iid exponentially distributed with a mean of 5 minutes. a) Fit an exponential distribution to the inter-arrival time data. Construct an Arena model for the teller queue at the bank. Run the model for an 8-hour day and estimate the expected customer delay in the teller queue. 1 b) Fit a uniform distribution to the inter-arrival time data above. Repeat the simulation run with the new inter-arrival time distribution. c) Discuss the differences between the results of the scenarios in a) and b). What do you think is the reason for the difference between the corresponding mean delay estimates? d) Rerun the scenario in a) above with a uniformly distributed service times with a mean of 5 minutes and compare the results to a) and b). e) Try to deduce the general rules from the results of a), b), and d) on how variability in the arrival process or the service process affects queue performance measures. 3. Hungry’s Fine Fast Foods is interested in looking at their staffing for the lunch rush hour, running from 10AM to 2 PM. People arrive as walk-ins, by car, or on a roughly scheduled bus as follows: o Walk-ins one at a time, inter-arrivals are exponential with a mean of 3 minutes; the first walk-in occurs EXPO(3) minutes past 10AM. o By car- with 1,2,3, or 4 people to a car with respective probabilities 0.2, 0.3. 0.3, and 0.2; inter-arrivals distributed as exponential with a mean of 5 minutes; the first car arrives EXPO(5) minutes past 10AM. o A single bus arrives every day sometime between 11AM and 1PM (arrival time is distributed uniformly over this period). The number of people on the bus varies from day to day, but it appears to follow a Poisson distribution with a mean of 30 people. Once people arrive, either alone or in a group from any source, they operate independently regardless of their source. - The first stop is with one of the servers at the order/payment counter, where ordering takes TRIA(1,2,4) minutes and payment takes TRIA(1,2,3) minutes; these two operations are sequential, first order taking then payment, by the server for a given customer. - The next stop is pickup the food ordered, which takes an amount of time distributed uniformly between 30 seconds and 2 minutes. - Then, each customer goes to the dining room which has 30 seats (people are willing to sit anywhere, not necessarily with their group), and partakes of the sublime victuals, taking an enjoyable TRIA(10,20,30) minutes. 2 - After that, the customer walks fulfilled to the door and leaves. Queueing at each of the three “service” stations (order/pay, pickup food, and pickup food to dining) is allowed with FIFO discipline. There is a travel time of EXPO(30) seconds from each station to all but the exit door– entry to order/pay, order/pay to pickup food, and pickup food to dining. After dining, people move more slowly, so that travel time from the dining room to the exit door is EXPO(1) minute. The servers at both order/pay and pickup food have a single break that they share on a rotating basis. More specifically, at 10 : 50, 11 : 50, 12 : 50, and 1 : 50, one server from each station goes on a 10 minute break; if the person due to go on break at a station is busy at break time, he or she finishes serving the customer, but still has to be back at the top of the hour (so the break could be a little shorter than 10 minutes.) The main issue facing Hungry’s is staffing. Currently there are six servers at the order/pay station and two at the pickup food station throughout the 4-hour period. Since they know that the bus arrives sometime during the middle two hours, they are considering a variable staffing plan that, for the first and last hour would have three at order/pay and three one at pickup food, and for the middle two hours would have nine at order pay and three at pickup food (n.b. that the total number of person-hours on the payroll is the same (32) under either the current staffing plan or the alternate plan, so the cost is the same. What is your advice? In terms of output, observe the average and maximum length of each queue; the average and maximum time in each queue; the total numbers of customers completely served and out the door. Develop a schematic plan of the restaurant either with Autocad or the Arena drawing tools. Estimate the sizes as best you can of the restaurant counter, kitchen, and dining areas, surrounding access roads, etc. Include a roadway for the arrival of the bus and for the cars. Make animation plots of the order/pay and dining room queues to examine that things are making sense. Animate all movements between stations. Pick from a .plb picture library a humanoid picture for the entities, and make an appropriate change in their appearance after they have finished eating and leave the dining room. Also, while you won’t be able to animate the individual servers or seats in the dining room, pick reasonable pictures for them as well. 3

