VSB and Receivers
advertisement
4. Vestigial Sideband Modulation (VSB) (see page ….)
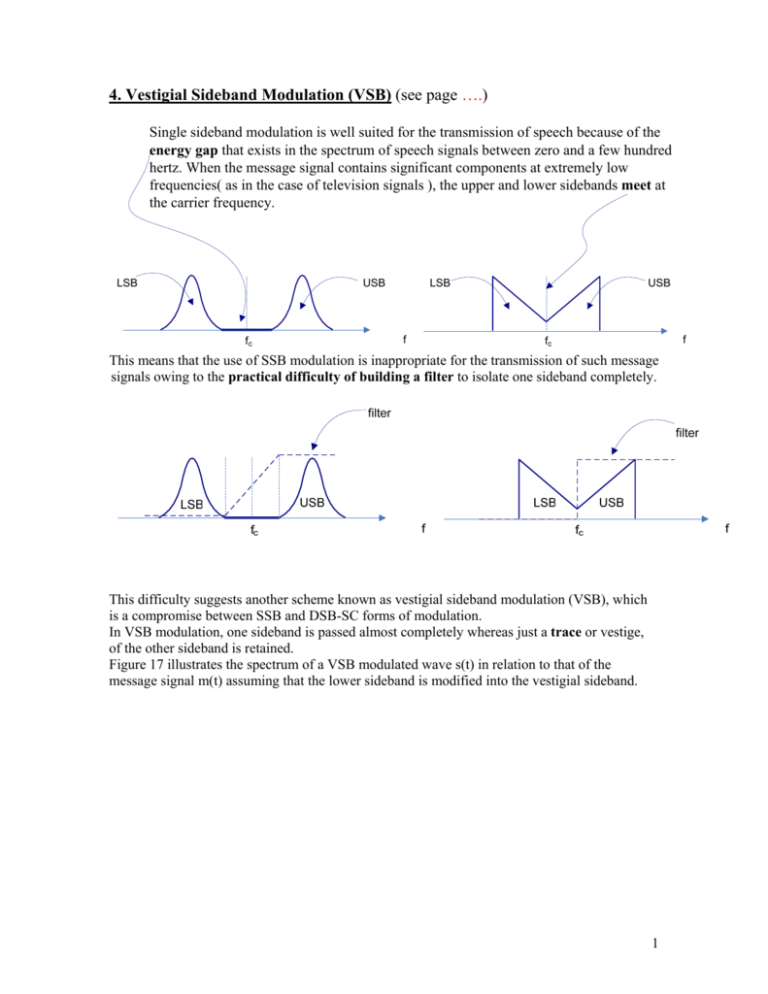
Single sideband modulation is well suited for the transmission of speech because of the
energy gap that exists in the spectrum of speech signals between zero and a few hundred
hertz. When the message signal contains significant components at extremely low
frequencies( as in the case of television signals ), the upper and lower sidebands meet at
the carrier frequency.
LSB
USB
fc
LSB
f
USB
f
fc
This means that the use of SSB modulation is inappropriate for the transmission of such message
signals owing to the practical difficulty of building a filter to isolate one sideband completely.
This difficulty suggests another scheme known as vestigial sideband modulation (VSB), which
is a compromise between SSB and DSB-SC forms of modulation.
In VSB modulation, one sideband is passed almost completely whereas just a trace or vestige,
of the other sideband is retained.
Figure 17 illustrates the spectrum of a VSB modulated wave s(t) in relation to that of the
message signal m(t) assuming that the lower sideband is modified into the vestigial sideband.
1
Fig 17.
|M(f )|
− fm
0
fm
f
| S( f ) |
fm
0
− fc − fm
− fc
− fc + fv
f
fc + fm
fv
fv + fm
fc − fv
fc
Specifically, the transmitted vestige of the lower sideband compensates for the amount removed
from the upper sideband.
The transmission bandwidth ( f T ) required by the VSB modulated wave is therefore
fT = f m + f v
To generate a VSB modulated wave, we pass a DSB-SC modulated wave through a sideband
shaping filter as in Fig 18.
Ac cos ωct
2
The key to VSB is the sideband filter, a typical transfer function being shown below:
Side − band filter
1
1
2
fc − β
fc
fc + β
f
While the exact shape of the response is not crucial, it must have odd symmetry above the
1
carrier frequency and a relative response of at f c . The filter response is designed so that the
2
original message spectrum M (ω ) is reproduced on demodulation as a result of the superposition
of two spectra:
On demodulation,
-
The positive frequency part of S (ω ) {i.e. spectrum of transmitted signal s(t)} is shifted
downward in frequency by f c .
-
The negative frequency part of S (ω ) is shifted upward in frequency by f c .
3
1
− fc − fm
− fc
− fc + fm
S( f )
(a)
fc − fm
0
fc
fc + fm
f
Spectrum of DSB − SC
1
− fc − fm
− fc
− fc + fm
SVSB ( f )
0
(b)
fc − fm
fc
fc + fm
f
Spectrum of VSB signal
Original spectrum
Demodulated output
spectrum
(c)
f
The magnitudes of these two spectral contributions are shown in (b) above.
In effect, a reflection of the vestige of the lower sideband makes up for the missing part of the
upper sideband.
Vestigial sideband modulation has the virtue of conserving bandwidth almost as efficiently as
single sideband modulation, while retaining the excellent low-frequency characteristics of
double sideband modulation.
The VSB modulation has become standard for the analogue transmission of television and
similar signals, where transmission of low-frequency components is important, but the
bandwidth required for double sideband transmission is unavailable.
In the transmission of television signals in practice, a controlled amount of carrier is added to
the VSB modulated signal. This is done to permit the use of and envelope detector for
demodulation. The design of the receiver is thereby considerably simplified.
4
Example: Let the message signal be the sum of tow sinusoids.
m(t ) = A1 cos ω1t + A2 cos ω 2 t
The message signal is multiplied by a carrier cos ω c t to form the DSB signal.
DSB-SC
s (t ) = ( A1 cos ω1t + A2 cos ω 2 t ) cos ω c t
=
1
1
1
1
A1 cos(ω c − ω1 )t + A2 cos(ω c − ω 2 )t + A2 cos(ω c + ω 2 )t + A1 cos(ω c + ω1 )t
2
2
2
2
Single sideband spectrum is shown below.
S( f )
1
2
− fc
A2
fc − f2
1
2
1
2
A1
f c − f1
fc
A1
f c + f1
1
2
A2
fc + f2
f
A vestigial sideband filter is then used to generate the VSB signal.
1
S( f )
1− ε
1
2
ε
− fc
fc − f2
f c − f1
fc
f c + f1
fc + f2
f
A vestigial sideband filter is then used to generate the VSB signal.
5
1
2
1
2
fc − f2
A1 (1 − ε )
1
2
A2
A1ε
f c − f1
fc
f c + f1
fc + f2
f
The spectrum of the VSB signal is
VSBspectrum =| S ( f ) | . | H ( f ) |
vVSB (t ) =
1
1
1
A1 cos(ω c − ω1 )t + A1 (1 − ε ) cos(ω c + ω1 )t + A1 cos(ω c + ω 2 )t
2
2
2
Demodulation:
vVSB (t )
v(t )
m(t )
4 cos(ωc t )
v(t ) = vVSB (t ).4 cos ω c t =
2 A1ε cos(ω c − ω1 )t. cos ω c t + 2 A1 (1 − ε ) cos(ω c + ω1 )t. cos ω c t + 2 A2 ε cos(ω c + ω 2 )t. cos ω c t
= A1ε [cos(2ω c − ω1 )t + cos ω1t ] + A1 (1 − ε )[cos(2ω c + ω1 )t + cos ω1t ] + A2 [cos(2ω c + ω 2 )t + cos ω 2 t ]
After low-pass filtering,
m(t ) = A1ε cos ω1t + A1 (1 − ε ) cos ω1t + A2 cos ω 2 t
⇒ m(t ) = A1 cos ω1t + A2 cos ω 2 t , which is the assumed message signal.
6
Reference: Communication systems engineering – Proakis and Salehi
Receivers for AM radio broadcasting
Commercial AM radio broadcasting utilises frequency band 535-1605 KHz for transmission of
voice and music.
The carrier frequency allocations range from 540-1600 KHz with 10 KHz spacing.
Radio stations employ conventional AM for signal transmission. The base-band message signal
m(t) is limited to a bandwidth of approximately 5KHz.
Since there are billions of radio receivers (radios) and relatively few radio transmitters, the use
of conventional AM broadcast is justified –the major objective is to reduce the cost of
implementing the radio receivers (radios).
The receiver most commonly used in AM broadcast is the so-called ‘superheterodyne
receiver’ shown in Fig 20.
s(t )
fc
fc
f IF
s BP (t )
f LO
f LO = f C ± f IF
It consists of:
•
•
•
A radio frequency (RF) tuned amplifier
[The RF amplifier has a band-pass characteristics that passes the desired signal and
provides amplification – Also provides some rejection of adjacent signals and noise].
A mixer (or frequency translator)
[The multiplication of the band-pass signal SBP(t) and the local oscillator output is
referred to as mixing].
A local oscillator
7
[The local oscillator frequency tracks with the RF tuning such
that f LO = f c + f IF or f LO = f c − f IF ( f c > f IF ) .
•
•
•
An Intermediate Frequency (IF) amplifier
[The mixer contents the RF output down to some convenient frequency band called
the intermediate frequency (IF)].
The IF filter is a band-pass filter which provides most of the gain.
An envelope detector
[Note that the envelope of the IF filter output is the same as the envelope for the RF
input. Envelope detector recovers the message]
An audio frequency amplifier and a loudspeaker.
In the superheterodyne receiver, every AM radio signal is converted to a common IF
of f IF = 455 KH Z . This conversion allows the use of a single tuned IF amplifier for signals from
any radio station in the frequency band.
The IF amplifier is designed to have a bandwidth of 10 KHz, which matches the bandwidth of
the transmitted signal.
The frequency conversion to IF is performed by the combination of the RF amplifier and the
mixer.
The frequency of a local oscillator :
455 KHz
f LO = f C + f IF
Carrier frequency of the
desired AM radio signal
[ f LO = f C + f IF
f LO > f C
High − side tuning ]
[ f LO = f C − f IF
f LO < f C
Low − side tuning ]
The tuning range of the local oscillator is 955- 2055 KHz [carrier: 540-1600 KHz]
By tuning the RF amplifier to f C and mixing with f LO = f C + f IF we obtain two signal
components:
•
•
One centred at the difference frequency
f IF [i.e. f LO − f C = f C + f IF − f C = f IF ]
The second centred at the sum frequency
2 f C + f IF [i.e. f LO + f C = f C + f IF + f C = 2 f C + f IF ]
Only the 1st one will pass through the IF amplifier.
At the input of the RF amplifier we have signals picked up by the antenna from all radio
stations.
By limiting the Bandwidth of the RF amplifier to the range,
8
Transmission bandwidth < bandwidth ( B RF ) <2 f IF
(BT)
,where BT is the bandwidth of the AM radio signal (10KHz), we can reject the radio signal
transmitted at the so-called image frequency,
′
′
f C = f LO + f IF [i.e. f LO = f C − f IF ]
What is image frequency?
Bpf ( IF amplifier )
f C or
f C + 2 f IF
f LO = f C + f IF
f IF
mixer output frequencies:
f C + f LO
&
f LO − f C
= 2 f C + f IF
&
f IF
(1)
f C + 2 f IF + f LO
(2)
= 2 f C + 3 f IF
&
&
f C + 2 f IF − f LO
f IF
Note
If we are attempting to receive a signal having carrier frequency f C , we will also receive a signal
f C + 2 f IF if the local oscillator f LO = f C + f IF .
∴
f c + 2 f IF is known as the image frequency.
9
Bpf ( IF amplifier )
f C or
f C − 2 f IF
f LO = f C − f IF
f IF
(1) f C + f LO
f C − f LO
&
= 2 f C − f IF
&
(2) f C − 2 f IF + f LO
= 2 f C − 3 f IF
f IF
&
&
f LO − ( f C − 2 f IF )
f IF
Note
If we are attempting to receive a signal having carrier frequency f C ,we will also receive a signal
f C − 2 f IF if the local oscillator f LO = f C − f IF
∴
f C − 2 f IF is known as the image frequency.
We have seen that there is only one image frequency, and it is always separated from the desired
frequency by 2 f IF .
The relationship between the desired signal to be demodulated and the image signal is
summarised in Fig 21 for low-side and high-side tuning.
The desired signal to be demodulated has a carrier frequency of f C and the image signal has a
carrier frequency of f I (see Fig 21).
10
2 f IF
Desired
Image
fi
Image Signal
f LO
f LO = f C + f IF
fC
Desired Signal
Low-side tuning
i.e. fC > fL
2 f IF
Image
Desired
fC
Desired Signal
f LO
f LO = f C + f IF
f i = f c + 2 f IF
Image Signal
High-side tuning
Fig 21.
11
Illustration of image frequency high-side tuning(i.e. f LO = f C + f IF )
mixer
X
f C or
IF
f C + 2 f IF
(image signal)
f LO = f C + f IF
Desired signal
Desired signal
fC
f
Local oscillator
f LO = f C + f IF
f
Signal at the
mixer output
2 f C + f IF
f IF
f
Image Signal
f C + 2 f IF
f
Image signal at
mixer output
f IF
f
Pass-band of
IF filter
Fig 22.
12
Fig 22 shows the desired signal and the image signal for a local oscillator having the
frequency f LO = f C + f IF .
The image frequency can be eliminated by the radio –frequency (RF) filter. Thus the image
frequency is separated from the desired signal by almost 1 MHz when IF for AM radio is 455
KHz.
RF input spectrum
Bandwidth( B
)
RF
B <B
<2f
T
RF
IF
RF filter
RF input
Image
X
X
Y
Y
f i = f c + 2 f IF
fC
Desired Signal
f LO = f C + f IF
f
Image Signal
Adjacent stations
BIF
IF input
X
X
IF filter
Y
Y
f
Adjacent
channels
Bandwidth of IF ≈ Bandwidth of Transmission (BT)
∴ Adjacent channels are rejected.
13
Superheterodyne AM receiver:
fc =
1
2π LC
10 KHz = BIF = BT
f = f IF = 455KHz
s(t )
fc
f
BRF
BRF > BT
The superheterodyne structure results in several practical benefits:
•
First tuning takes place entirely in the ‘front’ end so the rest of the circuitry, including the
demodulator requires no adjustment to change f C .
•
The separation between f C and f IF eliminates potential instability due to
stray feedback from the amplified output to the receiver’s input .
•
Most of the gain and selectivity is concentrated in the IF stage.
14
The centre frequency selected for the IF amplifier is chosen on the basis of three considerations:
•
•
•
The IF should be such that a stable high-gain IF amplifier can be economically attained.
The IF frequency needs to be low enough so that, with practical circuit elements in the IF
filters provide a steep attenuation characteristic outside the bandwidth of the IF signal. This
decreases the noise and minimises the interference from adjacent channels.
The IF frequency needs to be high enough so that the receiver image response can be made
very small.
The local oscillator tuning ratio:
For example, with AM broadcast radio, where 540< f C <1600 KHz and f IF = 455 KHz using
f LO = f C + f IF
Resulting in
995 KHz< f LO <2055 KHz
And thus a local oscillator tuning range of 2:1. (i.e. 2055/995 ≈ 2/1).
On the other hand ,if we choose f LO = f C − f IF then for the same IF and input frequency range,
We get
85< f LO <1145 KHz
Or a local oscillator tuning range of 13:1(i.e.1145/85)
Note:
If
f LO > f C the sideband of the IF output will be inverted (i.e. upper-side band on the RF input
will become the lower-side band etc.)
If f LO < f C , the side band s are not inverted.
Automatic gain control
Superheterodyne receivers often contain an automatic gain control (AGC) such that the
receiver’s gain is automatically adjusted according to the input signal level.
AGC is accomplished by rectifying the receiver’s audio signal, thus calculating the average
value.
This dc Value is then fed to the IF (or RF) stage to increase or decrease the stages gain. An AM
radio usually includes an automatic volume control (AVC) signal from
Demodulator back to the IF (see Fig20, page93).
15
Example
Consider a block diagram of the mixer of a superheterodyne receiver.
f IF = 455KHz
AM wave
s (t )
X
IF amplifier
f LO
Local
oscillator
The input signal is an AM wave of bandwidth 10 KHz and the carrier frequency that may lie
anywhere in the range 535 KHz to 1605KHZ. It is then required to translate this signal to a
frequency band centred at a tuned IF of 455 KHz.
Find the range of tuning that must be provided in the local oscillator in order to achieve this
requirement. You may assume low-side tuning.
Let f LO be the local oscillator frequency;
(Low-side tuning)
f LO = f C − f IF
When f C = 535KHz
f LO = 0.535 -0.455 MHz = 80 KHz
When f C = 1605KHz
f LO = 1.605 − 0.455MHz = 1150 KHz
Thus the required range of tuning of the local oscillator is 80 KHz to1150KHz independent of
the AM signal bandwidth.
Example
A superheterodyne receiver with f IF = 455KHz and 3500 KHz < f LO < 4000 KHz has a tuning
dial calibrated to receive signals from 3 to 3.5MHz. The receiver is set to receive a 3 MHz
signal. The receiver has a broadband RF amplifier and it has found that the local oscillator has a
significant 3 rd harmonic component output.
If a signal is heard, what are all its possible carrier frequencies?
(You may assume upper-side tuning).
16
Broadband
(in this case)
s(t )
f IF = 455KHz
X
RF amplifier
fc
IF amplifier
f LO & 3 f LO
Local
oscillator
Third harmonic component
If f C is set to 3.0 MHz (given) then f LO = f C + f IF = 3.0 + 0.455 = 3.455MHz
Image frequency f i = f C + 2 f IF (Page98_fig21)
f i =3.0+2(0.455)
f i = 3.91 MHz
possible carrier
Frequency
But the oscillators 3 rd harmonic component is 3 × f LO = 10.365MHz
∴ f C ′ = 3 f LO − f IF = 10.365 − 0.455 = 9.910MHz
Possible carrier frequency
Corresponding image frequency is
′
′
f i = f C + 2 f IF = 9.910 + 2(0.455) = 10.820 MHz
With this receiver, even though the dial states the received station is 3.0MHz, it may also receive
3.91MHz, 9.910MHz, and 10.820MHz.
Note: AM broadcast technical standard.
In US, the federal communication commission (FCC) technical standard for AM broadcast
stations are shown below:
• assigned Frequency , f C
In 10KHz increments from 540 to 1700KHz
• channel bandwidth
10 KHz
± 20Hz of the assigned frequency
• carrier frequency stability
640 650 660 670 ….,1,020,…..
• clear channel frequencies
(50KW stations, non directional)
1, 100, ………and 1210 KHz, etc.
(These stations united to cover areas, operated day and night)
• maximum power licensed
50 KW
17
Phase –locked loops (PLL)
A phase-locked loop (PLL) consists of three basic components:
(1)A phase detector
(2)A low pass filter
(3)A voltage controlled oscillator (VCO) as shown in Fig23.
vi (t )
v L (t )
v P (t )
vo (t )
vo (t )
The (VCO) is an oscillator that produces a periodic waveform with a frequency that
may be varied about some free-running frequency f O.
f O − is the frequency of the VCO output when the applied voltage vl (t ) = 0 .
The phase detector produces an output signal v P (t ) that is a function of the phase difference
between the incoming signal vi (t ) and the oscillator signal vO (t ).
The filtered signal output v L (t ) is the control signal that is used to change the frequency of the
VCO output.
If the applied signal has initial frequency of f 0 , the PLL will acquire a ‘lock’ and the VCO will
track the input signal frequency over some range, provided that the input frequency changes
slowly.
However the loop will remain locked only over same finite range of frequency shift. This range
is called hold-in (or lock –in) range.
The holed-in range depends on the overall dc gain of the loop, which includes the dc gain of the
LPF.
On the other hand, if the applied signal has an initial frequency different from f 0 , the loop may
not acquire lock even though the input frequency is within the hold-in range. The frequency
18
range over which the applied input will cause the loop to lock is called the pull- in (or capture)
range.
v L (t )
f O − Δf O
f O − Δf O
f O − Δf O
′
fO
f O + Δf O
′
f O + Δf O
f
fO
0
f O + Δf O
The pull-in range is determined primarily by the loop filter characteristics and it is never greater
than hold- in range.
Another important PLL specification is the maximum locked sweep rate which is
defined as the maximum rate of change of the input frequency for which the loop will remain
locked.
If the input frequency changes faster than thin rate, the loop will drop out of lock.
The PLL uses a multiplier as a phase detector.
vi (t )
v P (t )
v L (t )
Assume that the input signal is:
vi (t ) = Ai sin(ω 0 t + θ i (t )) (40)
And that the VCO output signal is:
v0 (t ) = A0 cos(ω 0 t + θ 0 (t )) (41)
t
where θ 0 (t ) = K V ∫ v L (τ )dτ (42)
0
K V is the VCO gain constant (radians per second unit input}
19
v P (t ) = k m Ai Ao sin(ω 0 t + θ i (t )). cos(ω 0 t + θ o (t )) =
k m Ai Ao
k AA
sin(θ i (t ) − θ o (t )) + m i o sin(2ω 0 t + θ i (t ) + θ o (t ))
2
2
(43).
km
v (t ) =
L
k AA
m i o . sin(θ (t ) − θ (t ))
i
o
2
= kd
θ e (t )
When the PLL is operating in lock the phone error θ e ≈ 0 (or very small)
∴ θ (t ) = θ (t )
∴
i
0
The VCO phase θ (t ) is a good estimate of the input-phase deviation θ i (t ).
20
Costas loop
Figure 22 below may be used to demodulate the DSB.SC signal. (Note an ordinary PLL cannot
be used because there are no components at ± f C − carrier suppressed.
1
v1 (t ) = ( Ao Ac cos θ e )m(t )
2
m(t )
Ao cos(ω c t + θ e )
v 4 (t )
s (t ) = Ac m(t ) cos ω c t
v3 (t )
Ao sin(ω c t + θ e )
1
v 2 (t ) = ( Ao Ac cos θ e )m(t )
2
The Costas PLL is an analysed by assuming that the VCO locked to the input suppressed carrier
frequency f C with a constant phase error of θ e , then the voltage
v1 (t ) and v 2 (t )are obtained at the output of the lowpass filters as shown above.
Since θ 2 is small, the amplitude of v1 (t ) is relatively large compared to that of v2 (t )
(i.e. cos θ e >> sin θ e ) .
Furthermore v1 (t ) is proportional to m(t ) so it is the demodulated output.
v3 (t ) = v1( (t ).v3 (t )
1 1
= ( A0 AC ) 2 m 2 (t ) sin 2θ e
2 2
The voltage v3 (t ) is filtered with an LPF that has a cut-off frequency near dc so that this filter
acts as an integrated to produce the dc for the VCO,
1 1
V4 (t ) = K sin 2θ e where k = ( A0 AC ) 2 < m(t ) 2 > average. i.e DC level of m 2 (t )
2 2
The dc control voltage is significant to keep the VCO locked to f C with a small phase error θ e .
21
