Chapter 14. Doppler Measurement
advertisement
443
_____________________________________________________________________
Chapter 14.
Doppler Measurement
14.1.The Doppler Shift
The apparent difference between the frequency at which sound or light waves leave a
source and that at which they reach an observer, caused by relative motion of the
observer and the wave source. This phenomenon is used in astronomical
measurements, in radar and modern navigation. It was first described (1842) by
Austrian physicist Christian Doppler.
Examples of the Doppler effect include the following:
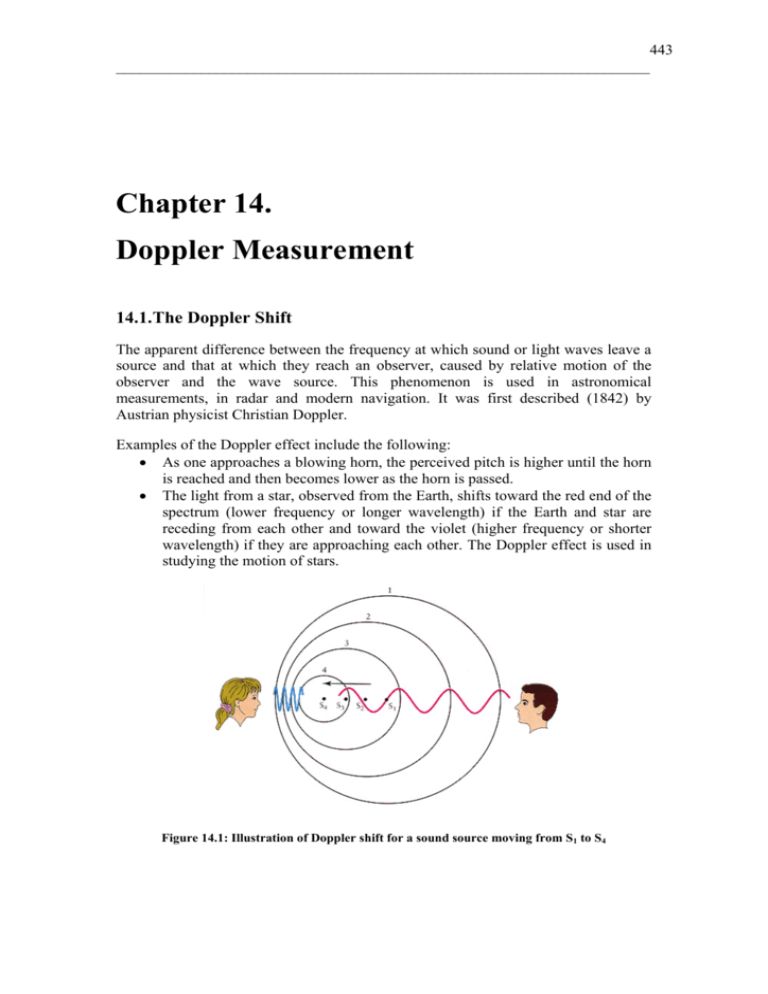
• As one approaches a blowing horn, the perceived pitch is higher until the horn
is reached and then becomes lower as the horn is passed.
• The light from a star, observed from the Earth, shifts toward the red end of the
spectrum (lower frequency or longer wavelength) if the Earth and star are
receding from each other and toward the violet (higher frequency or shorter
wavelength) if they are approaching each other. The Doppler effect is used in
studying the motion of stars.
Figure 14.1: Illustration of Doppler shift for a sound source moving from S1 to S4
444
_____________________________________________________________________
14.1.1. Doppler Shift Derivation
Consider the relationship between the frequency of sound produced by a source
moving with velocity vs and the frequency received by a receiver moving with
velocity vr. For simplicity, assume that the both the source and the receiver are
moving in a straight line in the same direction.
At time t = 0, the source, S, and receiver R are separated by a distance d.
d
S
R
Vr
Vs
The source emits a wave that propagates at velocity c and reaches the receiver after
time t.
ct
d
Vrt
S
R
R'
As the receiver has moved vr.t metres
ct = d + vr t ,
(14.1)
or
t=
d
.
c − vr
(14.2)
At time τ the source, S, would have moved τvs. Let the wave emitted at that instant be
received at time t’ by R. In this time R would have moved vrt’
c(t'-τ)
d
Vrt'
Vsτ
S
S'
R
c(t ′ − τ ) = (d − vsτ ) + vr t ' ,
R"
(14.3)
making
t′ =
d + (c − vs )τ
,
c − vr
(14.4)
Thus for the receiver, the interval between the waves has been
τ ′ = t′ − t =
c − vs
τ.
c − vr
(14.5)
445
_____________________________________________________________________
Whereas for the source, the interval between waves has been τ. Now the number of
waves emitted in τ by the source must equal the number of waves received by the
receiver in τ’
f rτ ′ = f sτ ,
(14.6)
making
fr =
c − vr
fs .
c − vs
(14.7)
For vs and vr << c
1 − vr / c
⎡ v ⎤⎡ v ⎤
fr =
f s = ⎢1 − r ⎥ ⎢1 − s ⎥
c ⎦⎣
c⎦
1 − vs / c
⎣
−1
.
(14.8)
Expanding the last term using the binomial expansion
(1 + x )n = 1 + nx + n(n − 1) x 2 + ... .
(14.9)
2!
For x<<1, the higher order terms can be ignored
⎡ v ⎤⎡ v ⎤ ⎛ v ⎞
f r ≈ ⎢1 − r ⎥ ⎢1 + s ⎥ = ⎜1 − rs ⎟ f s .
c ⎦⎣
c⎦ ⎝
c ⎠
⎣
(14.10)
where vrs = vr − vs is the velocity of the receiver relative to the source
The Doppler shift is thus
fd = fr − fs =
− vrs
fs .
c
(14.11)
The frequency moving away from the source will be less than the frequency measured
at the source, whereas the frequency measured at a receiver moving towards the
source will be greater than the frequency measured at the source
14.2.Doppler Geometry
In most Doppler sensors both the transmitter and receiver are stationary, and they
illuminate a moving target. In addition, for some applications (Doppler ultrasound
imaging) they may not be co located as shown below
Transmitter
Receiver
θr
θt
Target
v
Figure 14.2: Doppler geometry: separated transducers
446
_____________________________________________________________________
The velocity of the target relative to the transmitter will be v cosθ t and the velocity of
the target relative to the receiver will be v cosθ r
The Doppler shift arising under these circumstances can be calculated assuming that:
• The target is a receiver moving away from the source with a velocity
v cosθ t
• The receiver is moving away from the target (source) with a velocity
v cosθ r
This is equivalent to the receiver moving away from the source with velocity
v cosθ t + v cosθ r even though both are stationary.
14.2.1. Targets moving at low velocities (v<<c)
The Doppler frequency for separated transducers is
fsv
(cosθ t + cosθ r ) ,
c
(14.12)
2 fsv
⎛θ + θt ⎞ ⎛θr −θt ⎞
cos⎜ r
⎟ cos⎜
⎟.
c
⎝ 2 ⎠ ⎝ 2 ⎠
(14.13)
fd = −
fd = −
If the transmit and receiver transducers are co located then θr ≈ θt = θ and the formula
for the Doppler frequency reduces to
fd = −
2 fsv
2v
cosθ = − cosθ .
c
λs
(14.14)
14.2.2. Targets Moving at High Speed (v<c)
In this case it is not possible to use the EM radiation approximation, and the whole
formula must be used for separated transducers. This is almost always the case with
ultrasound measurements in air.
fr =
c − v cosθ r
fs ,
c + v cosθ t
(14.15)
And the Doppler frequency is
fd = fr − fs .
For co-located transducers θr ≈ θt = θ just substitute for a common angle.
(14.16)
447
_____________________________________________________________________
14.3.Doppler Frequency Extraction
This section outlines the instrumentation required to detect Doppler shifts in a
received signal.
ftx
Coupler
Transmitter
Circulator
ftx
frx
Spectrum
Analyzer
Amp
Filter
v
Antenna
Mixer
Frequency
ftx
fd
Td
Receiver
Output
Amplitude
frx
Time
fd
Time
Receiver
Output
Spectrum
fd
2/Td
Frequency
Figure 14.3: Configuration of a generic Doppler sensor
The transmitted signal is of the form
xt (t ) = ξ t cos(ϖ s t )
(14.17)
The corresponding received signal from a single target will be
x r (t ) = ξ r cos([ϖ s + ϖ d ]t + φ ) ,
(14.18)
where φ - phase term dependent on the distance to the target (rad),
ϖs - 2πfs (rad/s),
ϖd - 2πfd (rad/s).
The two signals are mixed (multiplied together) to produce
xt (t ) x r (t ) = ξ t ξ s cos(ϖ s t ) cos([ϖ s + ϖ d ]t + φ )
=
ξ tξ r
2
{cos(ϖ d t + φ ) + cos([2ϖ s + ϖ d ]t + φ )}
(14.19)
448
_____________________________________________________________________
This signal is low pass filtered as shown in the figure below to remove the component
at 2fs leaving only the Doppler signal
x d (t ) =
ξ tξ r
2
cos(ϖ d t + φ ) .
(14.20)
Figure 14.4: Lowpass filter to remove the component at 2fs
The reflected signal amplitude from non-moving objects in the beam will be 40 to
50dB larger than the Doppler signal, and so additional high pass filtering is often
required to remove this.
14.3.1. Direction Discrimination
The Doppler process discussed above can provide only an absolute difference
frequency, it contains no information regarding the direction of motion.
A number of techniques can be applied to preserve this directional information:
• Sideband filtering
• Offset carrier demodulation
• In-phase/ quadrature demodulation
In the descriptions that follow, it mist be remembered that
• ϖd > 0 Target velocity towards the sensor
• ϖd < 0 Target velocity away from the sensor
449
_____________________________________________________________________
Sideband Filtering
The received signal is split and passed through two bandpass filters, one passing
signals over the range ϖs < ϖ < ϖs + ϖm and the other passing signals over the range
ϖs - ϖm< ϖ < ϖs. The output of each filter passes through a mixer and filter as usual.
If the target is approaching the signal appears in the first bin, and if it is receding then
it appears in the second
ω
Reference s
Bandpass
Filter
Audio
Bandpass
Filter
+ve shifted
Doppler
Bandpass
Filter
Audio
Bandpass
Filter
-ve shifted
Doppler
(ωs, ωs+ωm)
Signal in
(ωs-ωm, ωs)
Figure 14.5: Sideband filtering
Channel A
Channel B
ωin
ωin
Input
ωs−ωm
|ωs−ωin|
ωs
ωs
ωs+ωm
Output
|ωs−ωin|
Figure 14.6: Sideband filtering spectra in the two channels
Offset Carrier Demodulation
This process involves heterodyning (mixing) the received signal by a reference signal
ϖ1 + ϖs.
The received signal is
x r (t ) = ξ r cos([ϖ s + ϖ d ].t + φ ) ,
(14.21)
x1 (t ) = ξ1 cos([ϖ s + ϖ 1 ].t ) .
(14.22)
and the reference signal is
450
_____________________________________________________________________
Mixing the two signals (14.21) and (14.22) gives
x1 (t ) x r (t ) =
ξ1ξ r
2
{cos([ϖ 1 + ϖ d ].t + φ ) cos([2ϖ s + ϖ 1 + ϖ d ].t + φ )},
(14.23)
where ϖ1 is chosen so that ϖ1 > |ϖd max|,
and as usual the mixed signal is filtered to remove the component at 2ϖs.
ϖ1 + ϖd > ϖ1 +ve shift Doppler
ϖ1 + ϖd < ϖ1 -ve shift Doppler
Reference
(ωs+ωm)
Bandpass
Filter & Notch
Filter
Signal in
Doppler shifted
output signal
Figure 14.7: Offset carrier demodulation
ωa ωb
Input
ωs ωs+ω1
|ωs+ω1-ωb|
|ωs+ω1-ωa|
Output
ω1
Receding Approaching
Figure 14.8: Offset carrier spectra
In Phase/ Quadrature Demodulation
The received signal is split into two channels. In the in-phase channel, it is mixed with
the transmitted signal, and in the quadrature channel it is mixed with the transmitted
signal but phase shifted by π/2.
Mixing and filtering as before results in the following signals
i (t ) = cos(ϖ d t + φ )
q(t ) = sin(ϖ d t + φ )
(14.24)
451
_____________________________________________________________________
The direction of the Doppler shift, and hence the direction of flow is determined by
noting the phase relationship between i(t) and q(t).
• ϖd > 0, q(t) is π/2 retarded with respect to i(t)
• ϖd < 0, q(t) is π/2 advanced with respect to i(t)
ω
Reference s
Signal in
Audio
Bandpass
Filter
in phase
Doppler
Audio
Bandpass
Filter
quadrature
Doppler
90°
Figure 14.9: In-phase / quadrature demodulation
452
_____________________________________________________________________
14.4.Pulsed Doppler
Pulsed Doppler is identical to the CW version except that the transmit signal is
pulsed. This allows the technique to measure range as well as velocity. As shown in
the figure, a reference version of the transmitted signal must be maintained so that the
received signal can be synchronously detected
Pulse
Modulator
ftx
Transmitter
Coupler
Power
Amp
Circulator
ftx
frx
Spectrum
Analyzer
Antenna
Filter
Mixer
Figure 14.10: Pulsed Doppler ultrasound schematic diagram
The waveform that is received from a pulsed Doppler sensor in a specific range gate
is shown in the figure below in which it should be noted that the number of cycles
received during each return is a function of the pulsewidth and the Doppler frequency.
(a)
(b)
(c)
Figure 14.11: Pulsed Doppler waveforms (a) RF echo pulse train, (b) video pulse train for fd >1/τ
and (c) video pulse train for fd < 1/τ
The following waveforms show the basic pulsed Doppler technique extended to
incorporate In-phase and quadrature detection so that the direction of travel can be
determined. In this figure it can be seen that the Quadrature signal leads the In-phase
signal for a receding target (a) and that it lags the In-phase signal for an approaching
target (b).
Note that the in-phase and quadrature traces have been shifted on the display so that
they are easier to interpret.
453
_____________________________________________________________________
(a)
(b)
Figure 14.12: I and Q Doppler frequencies for a receding (a) and an approaching (b) target
454
_____________________________________________________________________
14.5.Doppler Sensors
Many sensors using both ultrasonic and radar technology make use of the Doppler
principle to measure target motion effects. Such sensors can either operate using
continuous wave (CW) or pulsed sources.
In general CW sources have no range discrimination, while pulsed sources can
determine both range and velocity.
14.5.1. Continuous Wave Doppler Ultrasound
Figure 14.13: Generic CW Doppler instrumentation measuring blood flow in an artery
CW ultrasound systems are used to measure fluid flow and the movement of internal
organs (particularly the heart) while industrial Doppler flowmeters measure flow in
pipes and canals. In all cases they rely on the acoustic signal reflecting off the moving
medium.
If a spectrogram is produced, then it is possible to identify specific target
characteristics that vary with time. For example, the following figures show the
difference between the return from a large dog and a human subject.
(a)
(b)
Figure 14.14: Doppler spectrograms of (a) human subject and (b) large dog both walking
towards the radar
455
_____________________________________________________________________
14.5.2. Continuous Wave Doppler Radar
CW Doppler radar has a myriad of uses. These include short range intruder detection,
moderate range sports and police radar for measuring the velocity of moving targets,
and long range aircraft tracking applications.
Intruder Detection
Figure 14.15: CW Doppler intruder detection. (a) a circuit for measuring Doppler frequency, (b)
circuit with a threshold detector and (c) Gunn microwave Doppler module
Specifications of a typical intruder system:
• Operational frequency typically X-band (8-12GHz)
• Output power 1-10mW
• Operational principle, Gunn oscillator iris-coupled to the common antenna
port that includes a mixer diode.
• Sometimes a varactor diode is mounted in the Gunn diode cavity to allow for
electronic control of the oscillation frequency
• Antenna port is generally flared into a horn to constrain the beam angle
456
_____________________________________________________________________
Sports Radar
(a)
(b)
Figure 14.16: Doppler sports radar units, (a) tripod mounted and (b) hand held
Specifications of a typical sports radar
• Operational frequency typically K-band (24.15GHz)
• Output power 40-100mW
• Antenna generally a large horn or a horn-lens
• Range depends on antenna size, output power and target RCS
• Accuracy +/-1km/h (typical)
Police Speed Trap
Figure 14.17: Police radar
Specifications of a typical police radar
• Operational frequency, X-band, K-band or Ka-band
• Accuracy +/- 0.2% Microwave +/- .15 MPH internal signal processing
• +1/4, -3/4 mph readout truncation system accuracy at 100 MPH +0.6/-1.1 mph
• Patrol speed range +16 to +75 mph
• Target Speed Range Stationary/Moving 15 mph thru 199 mph
• Target detection distance: Approx. 1000m.
457
_____________________________________________________________________
Aircraft Tracking Radar
ftx
Transmitter
Coupler
VCO
ftx
Circulator
ftx
fo+fd
DC
ftx
ftx+fo+fd
Frequency
Discriminator
IF
Filter
Amp
ftx+fd
ftx+fd
Antenna
fo
Mixer
Figure 14.18: CW Doppler aircraft tracking
The block diagram shows a simple aircraft tracking Doppler radar similar to the radar
shown in the photograph. The antenna is tracked manually in angles using one of the
telescopes. Automatic tracking is carried out only on the velocity. A narrow-band
tracking filter in the IF is used to reject noise and crosstalk from the transmitter. This
filter is followed by a discriminator that provides an error signal that drives an
automatic frequency control (AFC) loop which ensures that the received frequency
(ftx+/-fd) is downconverted to a constant IF, fo, irrespective of the actual Doppler
frequency.
There will be a minimum Doppler frequency below which the transmitter spillover
will swamp the received signal.
Figure 14.19: CW Doppler spectra for the tracking radar example
458
_____________________________________________________________________
14.5.3. Pulsed Doppler Ultrasound
Figure 14.20: Doppler ultrasound of blood flow through the heart
Conventional CW sensors are unable to measure range, and so they are unable to
separate Doppler signals returned from different targets within the beam except when
beam pairs are used as shown earlier in this chapter.
The primary differences between CW Doppler and pulsed Doppler are as follows:
• A single transducer can be used for transmission and reception because the
two are separated in time
• Pulsed Doppler can be incorporated into conventional pulsed echo ultrasound
(often known as duplex scanning)
• Periodic bursts of ultrasound typically only a few cycles long are used.
• Pulsed Doppler is only sensitive to flow within a region termed the sampling
volume.
Figure 14.21: Doppler ultrasound image of umbilical cord
Range resolution is achieved by transmitting a short burst of ultrasound.
459
_____________________________________________________________________
Following the burst, the received signal is mixed with a delayed version of the
transmitted pulse as reference. The time of flight of the transmitted pulse to the target
of interest and back again is equal to this delay. This allows the sampling volume to
be moved to different positions along the beam by altering the delay, and in this way,
flow at different depths can be selectively monitored. The width of the sampling
volume is equal to the transmitted beamwidth, and the length is equal to the pulse
width.
Imaging systems such as the one shown in the figure process the Doppler in a number
of consecutive range bins by running a reference CW oscillator continuously as
shown in the diagram.
14.5.4. Doppler Target Identification
Doppler signatures of moving targets can be used to differentiate between target types
at long range. From a military perspective, this discriminatory capability is extremely
useful, for example a high cost missile seeker needs to know whether the target it has
detected is a high-value tank or helicopter and a low-value truck.
(a)
(b)
Figure 14.22: Idealised Doppler spectra of (a) moving tank and (b) helicopter that can be used to
discriminate between different classes of moving targets
460
_____________________________________________________________________
14.5.5. Pulsed Doppler Radar
•
•
Pulsed Doppler radar systems such as
the NEXRAD weather surveillance
radar shown here operate using similar
principles to the imaging Doppler
ultrasound discussed above.
The RF return signal in each range
gate is down-converted to baseband
using the I/Q principle described
earlier in this section.
Figure 14.23: Doppler weather radar
The amplitude and phase of this echo pulse-train will vary with time as shown in (c)
for fd < 1/τ) in Figure.14.11. The Doppler spectrum is extracted from the time
waveform of each gate by processing blocks of data through a complex FFT
algorithm. The frequency and phase information that is output from each range gate is
converted to a radial velocity component from which actual wind velocity can be
inferred from the variation in radial velocity of adjacent gates and an understanding of
airflow dynamics.
Range and velocity, or range and reflectivity maps such as the one displayed below
can then be produced by displaying the data for all range gates over the 360° scan
angle of the radar.
Figure 14.24: Pulsed Doppler radar images of a storm over Oklahoma
An integral and important part of RNDSUP (Radar Network and Doppler Services
Upgrade) of the Australian Bureau of Meteorology is the implementation of a new
461
_____________________________________________________________________
national radar training program for Australian forecasters. As the Doppler radars are
implemented in each state, forecasters will undergo extensive radar training.
The image below is taken from the Doppler radar at Buckland Park. The air is moving
in the directions shown by the arrows.
Figure 14.25: Doppler radar display from the Australian bureau of meteorology used to improve
weather forecasting
14.6.References
[1]
[2]
[3]
[4]
[5]
D.Liley, The Doppler Principle, http://liley.physics.swin.oz.au, 03/03/2001.
Sports radar Gun, http://www.radarguns.com/specs/radar2000.html, 22/02/2000.
Weather Surveillance Radar, http://www.mws.noaa.gov/modernize/88dtech.html, 23/02/2000.
D.Barton, Radar Systems Analysis, Artech, 1976
How Stuff Works: Doppler Ultrasound, http://howstuffworks.com, 4/4/2001.
462
_____________________________________________________________________

