University of Arizona Department of Electrical and
advertisement
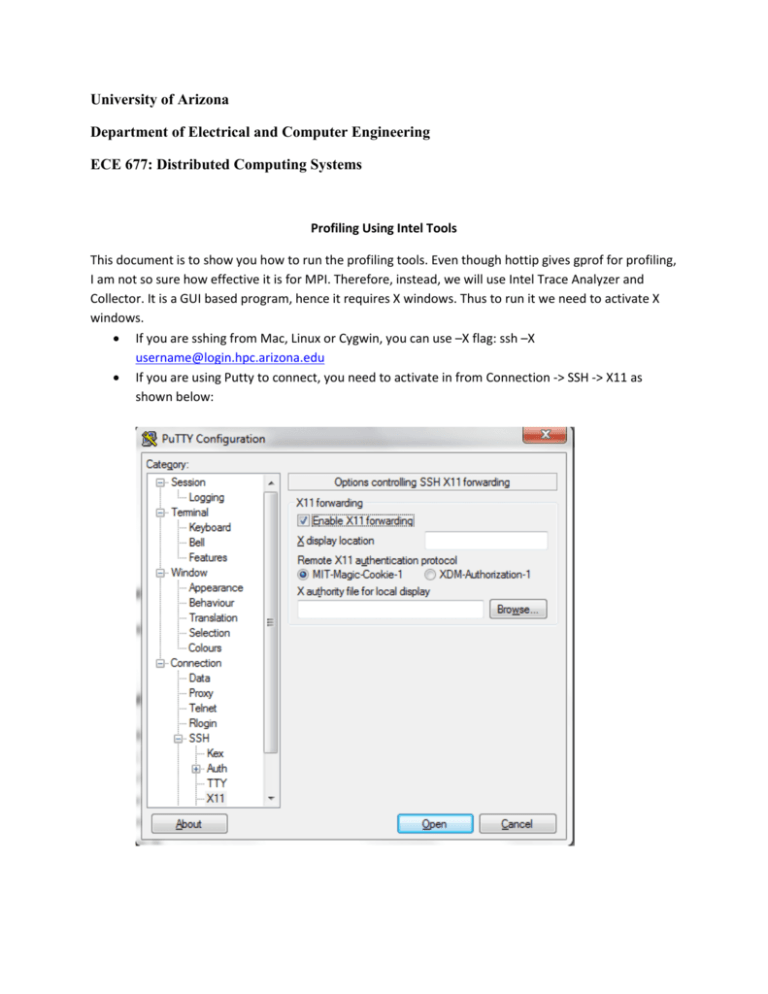
University of Arizona Department of Electrical and Computer Engineering ECE 677: Distributed Computing Systems Profiling Using Intel Tools This document is to show you how to run the profiling tools. Even though hottip gives gprof for profiling, I am not so sure how effective it is for MPI. Therefore, instead, we will use Intel Trace Analyzer and Collector. It is a GUI based program, hence it requires X windows. Thus to run it we need to activate X windows. If you are sshing from Mac, Linux or Cygwin, you can use –X flag: ssh –X username@login.hpc.arizona.edu If you are using Putty to connect, you need to activate in from Connection -> SSH -> X11 as shown below: Below are the steps you need to do to use Intel Trace Analyzer and Collector: After loading intel and intel-mpi modules, you need to load an environment file. module load intel intel-mpi source /uaopt/intel/2012.0.032/itac/8.0.3.007/bin/itacvars.csh While compiling our source codes, we need to use –trace flag. As an example: mpiicc -trace -o hello_trace mpi_hello_world.c Before running, we need to update our batch script and give the name of the new executable file After the execution is complete, it will create us “hello_trace.stf” file and we will use it in our analyzer. To analyze it with the profiler, use the following command: traceanalyzer hello_trace.stf It will show us a GUI window. Please note that the quality will depend on the program you are using as well as the connection You can get more information about it, how it works from the link below. http://nf.nci.org.au/facilities/software/intel-itac/8.0.1.009/doc/Getting_Started.html Cihan Tunc

