Web Based Interactive Exercises for the Earth
advertisement
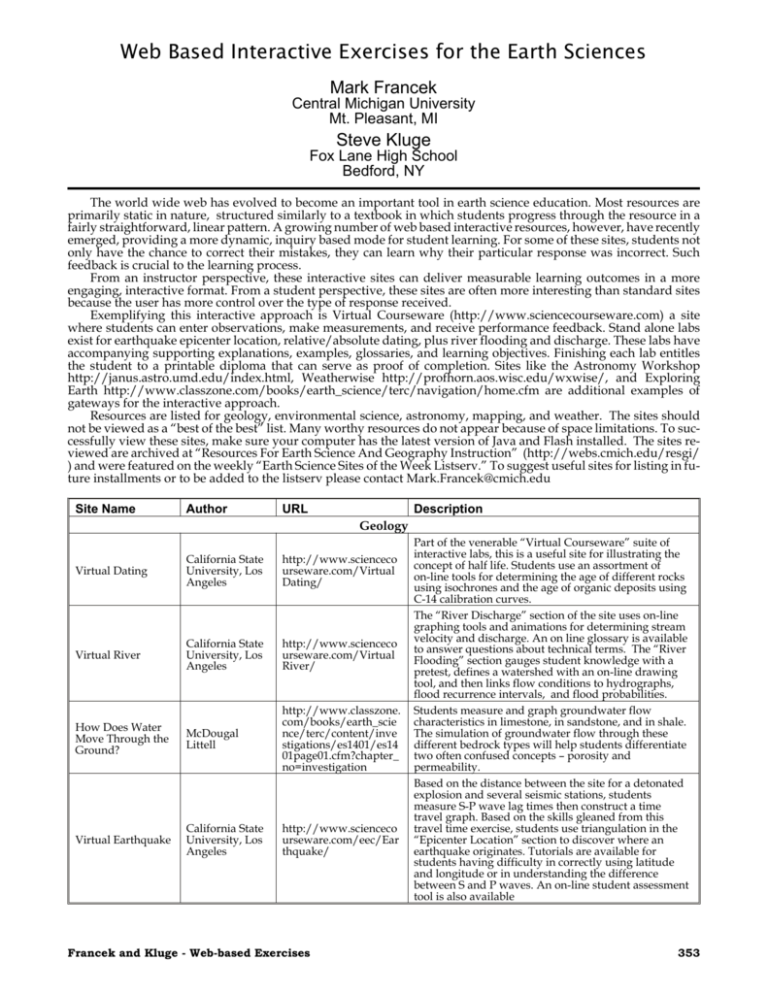
Web Based Interactive Exercises for the Earth Sciences Mark Francek Central Michigan University Mt. Pleasant, MI Steve Kluge Fox Lane High School Bedford, NY The world wide web has evolved to become an important tool in earth science education. Most resources are primarily static in nature, structured similarly to a textbook in which students progress through the resource in a fairly straightforward, linear pattern. A growing number of web based interactive resources, however, have recently emerged, providing a more dynamic, inquiry based mode for student learning. For some of these sites, students not only have the chance to correct their mistakes, they can learn why their particular response was incorrect. Such feedback is crucial to the learning process. From an instructor perspective, these interactive sites can deliver measurable learning outcomes in a more engaging, interactive format. From a student perspective, these sites are often more interesting than standard sites because the user has more control over the type of response received. Exemplifying this interactive approach is Virtual Courseware (http://www.sciencecourseware.com) a site where students can enter observations, make measurements, and receive performance feedback. Stand alone labs exist for earthquake epicenter location, relative/absolute dating, plus river flooding and discharge. These labs have accompanying supporting explanations, examples, glossaries, and learning objectives. Finishing each lab entitles the student to a printable diploma that can serve as proof of completion. Sites like the Astronomy Workshop http://janus.astro.umd.edu/index.html, Weatherwise http://profhorn.aos.wisc.edu/wxwise/, and Exploring Earth http://www.classzone.com/books/earth_science/terc/navigation/home.cfm are additional examples of gateways for the interactive approach. Resources are listed for geology, environmental science, astronomy, mapping, and weather. The sites should not be viewed as a “best of the best” list. Many worthy resources do not appear because of space limitations. To successfully view these sites, make sure your computer has the latest version of Java and Flash installed. The sites reviewed are archived at “Resources For Earth Science And Geography Instruction” (http://webs.cmich.edu/resgi/ ) and were featured on the weekly “Earth Science Sites of the Week Listserv.” To suggest useful sites for listing in future installments or to be added to the listserv please contact Mark.Francek@cmich.edu Site Name Author URL Description Geology Virtual Dating California State University, Los Angeles http://www.scienceco urseware.com/Virtual Dating/ Virtual River California State University, Los Angeles http://www.scienceco urseware.com/Virtual River/ How Does Water Move Through the Ground? McDougal Littell http://www.classzone. com/books/earth_scie nce/terc/content/inve stigations/es1401/es14 01page01.cfm?chapter_ no=investigation Virtual Earthquake California State University, Los Angeles http://www.scienceco urseware.com/eec/Ear thquake/ Francek and Kluge - Web-based Exercises Part of the venerable “Virtual Courseware” suite of interactive labs, this is a useful site for illustrating the concept of half life. Students use an assortment of on-line tools for determining the age of different rocks using isochrones and the age of organic deposits using C-14 calibration curves. The “River Discharge” section of the site uses on-line graphing tools and animations for determining stream velocity and discharge. An on line glossary is available to answer questions about technical terms. The “River Flooding” section gauges student knowledge with a pretest, defines a watershed with an on-line drawing tool, and then links flow conditions to hydrographs, flood recurrence intervals, and flood probabilities. Students measure and graph groundwater flow characteristics in limestone, in sandstone, and in shale. The simulation of groundwater flow through these different bedrock types will help students differentiate two often confused concepts – porosity and permeability. Based on the distance between the site for a detonated explosion and several seismic stations, students measure S-P wave lag times then construct a time travel graph. Based on the skills gleaned from this travel time exercise, students use triangulation in the “Epicenter Location” section to discover where an earthquake originates. Tutorials are available for students having difficulty in correctly using latitude and longitude or in understanding the difference between S and P waves. An on-line student assessment tool is also available 353 Site Name Author URL Description Geology Two small but powerful programs are available for download here. Seismic Wave provides both surface and interior animations of seismic waves’ paths through the earth. Seismic Eruption will plot real earthquakes and volcanoes on a map in time sequence, essentially creating a map of plate boundaries. Users can zoom in on any place on the globe, and view the area from any perspective (profiles are great for illustrating subduction zones!) Alan L. Jones (SUNY Binghamton) http://www.geol.bing hamton.edu/faculty/jo nes/jones.html EPA’s Personal Greenhouse Gas Calculator EPA Environmental Science This online calculator estimates a household’s greenhouse gas emissions based on the number http://yosemite.epa.go of people living in a household, choice of home v/oar/globalwarming. heating and transportation, and participation in nsf/content/Resource CenterToolsGHGCalcu product recycling. Another section of the site explores actions that a family can take to lower lator.html CO2 emissions plus reduce expenditures on energy and waste disposal costs. Astronomy Solar System Collisions Douglas Hamilton, University of Maryland http://janus.astro.umd .edu/astro/impact.htm l Observe the Change in a Star’s Spectrum as its Motion Changes. McDougal Littell http://www.classzone. com/books/earth_scie nce/terc/content/visu alizations/es2802/es28 02page01.cfm?chapter_ no=visualization Skyview Cafe Planetarium Skyview cafe.com http://www.skyviewc afe.com/skyview.php The Earth Moon Viewer John Walker, Fourmilab http://www.fourmilab .to/earthview/vplanet. html Seismic Wave and Seismic Eruption Kepler’s Laws Moving Point Source: Doppler Effect and Shock Wave 354 Fu-Kwun Hwang, National Taiwan University Fu-Kwun Hwang, National Taiwan University http://www.phy.ntnu. edu.tw/java/Kepler/K epler.html http://www.phy.ntnu. edu.tw/java/Doppler/ Doppler.html Send a rock, ice, or iron projectile of various sizes hurtling at different velocities toward any planet in the solar system. View whether the collision results in an air burst above the ground or a terrestrial impact, the estimated crater dimensions, and amount of energy released as a result of the collision. Adjust the speed of an approaching or retreating star and observe the resulting blue or red shift of the light emitted. The resultant change in the star’s spectrum (red-away, blue-toward) in reference to a standard reference spectrum allows students to determine relative motion. This interactive planetarium can be set to any location, any time, and any date. The time can also be rapidly advanced in varying increments allowing students to manipulate the sun’s path across the sky, the location of subsolar point, the boundary of day and night, and the location of constellations and planets. View topographic, cloud, and weather maps from varying altitudes above the earth. The site is useful for showing earth features and seasonal changes from a variety of perspectives and from a variety of scales. This site allows the user to adjust various aspects of orbits and observe the resulting changes in orbital shape, period, and orbital velocity. A nice touch is the addition of a vector arrow indicating orbital velocity at each instant of time. Students can adjust the speed of a moving wave emitting object, along with the emitted wave speed and wavelength. Frequency variation is easily observed, as are bow shocks of super sonic motion. This animation is a good way to introduce the red shift Journal of Geoscience Education, v. 52, n. 4, September, 2004, p. 353-355 Site Name Author URL Description Mapping Gallery of Virtual Topography Stephen J. Reynolds and Julia K. Johnson (Arizona State University) http://geology.asu.ed u/~sreynolds/topo_ga llery/topo_home.htm 3D Geologic Map Gallery Stephen J. Reynolds (Arizona State University) http://geology.asu.ed u/~sreynolds/geomap 3d/geomap3d_home.ht m Great Circle Calculator (GUI) Andrew Gray http://www.andrew-g ray.com/dist/ Find your longitude PBS http://www.pbs.org/ wgbh/nova/longitude /findgame.html This site is packed with interactive QuickTime movies (some allowing rotation and tilting) illustrating the appearance of various topographic features on topo maps. A favorite is one that allows the user to slowly flood (and drain) a landscape, and to compare the shorelines you create with the map. You’ll have to create your own lessons to go with the maps, but that will be easy with the wealth of movies available here. Files are big, but the authors encourage downloading of the movies and keeping a permanent copy on your local machine. This great site contains many shaded relief topo maps with geologic maps draped over them. A little more advanced than many of the other sites listed here, but a great way to show students how geology can influence topography, and to introduce them to geologic maps and structural geology in a clear, visual, interactive format. The adage that the shortest distance between two points is a straight line doesn’t necessarily apply when estimating distances using the two dimensional surface of a map. Find the shortest distance between two points on the earth’s surface using the great circle route. Animated plots of this route can be entered manually or from a list of almost 400 cities from around the world. For an interesting result, plot the route between southern Alaska and South Africa. To determine longitude, anchor a spot on the globe and then compute position by comparing current local time with Greenwich time. The site is richly supplemented with hyperlinks defining unfamiliar terms and has a variety of location-time problems at varying difficulty levels. A similarly high quality interactive site, “GPS: The New Navigation” http://www.pbs.org/wgbh/nova/longitude/gps/ promotes an understanding of how GPS works. Weather Friction and Fly Balls WeatherWiseUn iversity of Wisconsin http://profhorn.meteo r.wisc.edu/wxwise/ba seball/homerun.ht Contour Analysis WeatherWiseUn iversity of Wisconsin http://profhorn.meteo r.wisc.edu/wxwise/co ntour/index.html WeatherWiseUn iversity of Wisconsin http://profhorn.meteo r.wisc.edu/wxwise/rel hum/ rh.html ml Francek and Kluge - Web-based Exercises This entertaining site shows how the distance traveled by a hardball is impacted by air density friction (altitude), speed of the ball leaving the bat, and angle at which the ball leaves the bat. Interesting patterns emerge when for such cities as New York, which is near sea level, and Denver, the “Mile High” city. A draw tool allows students to practice contouring skills on seven exercises with progressively greater complexity. While the data contoured deal with variables like temperature and ocean salinity, the skills gained at the site will be readily transferable for plotting elevation with topographic maps. Adjust the thermostat and outside dewpoint/outside temperature to see the effect on indoor relative humidity. Observe the impact of such activities as opening and shutting the door, taking a shower, and running a humidifier. Unhealthy low levels of humidity often result in northern portions of the U.S. from the combination of low outdoor dew points and indoor temperatures maintained in the comfort zone of 20º C (68º F). 355
