Chi-Square Worksheet
advertisement

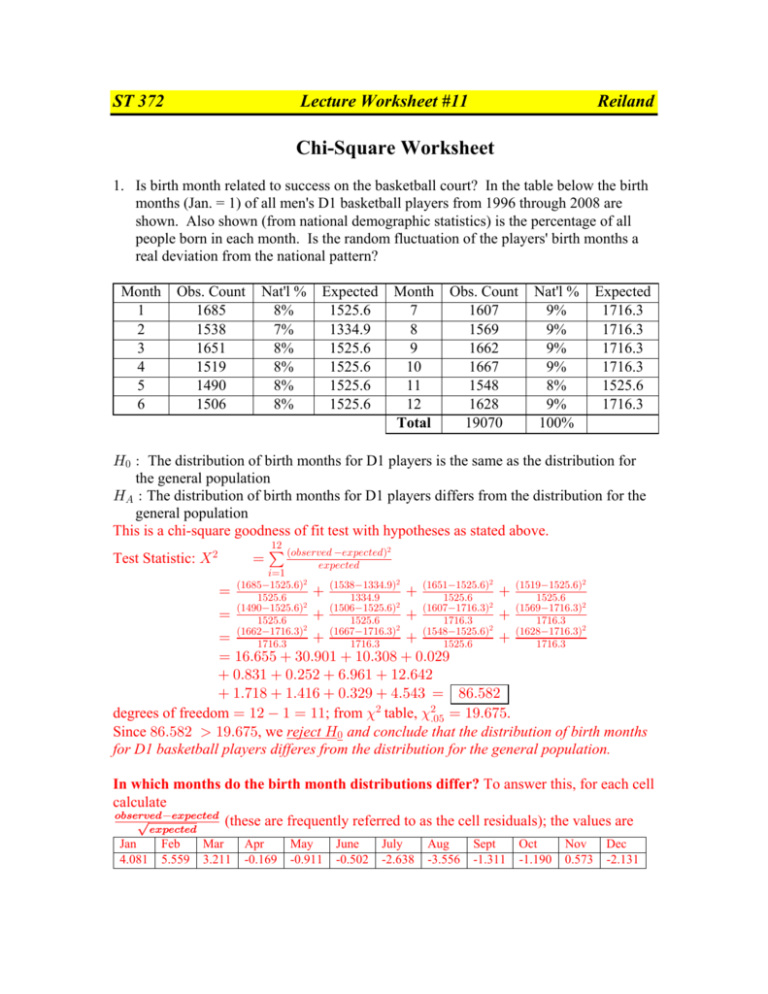
ST 372 Lecture Worksheet #11 Reiland Chi-Square Worksheet 1. Is birth month related to success on the basketball court? In the table below the birth months (Jan. = 1) of all men's D1 basketball players from 1996 through 2008 are shown. Also shown (from national demographic statistics) is the percentage of all people born in each month. Is the random fluctuation of the players' birth months a real deviation from the national pattern? Month 1 2 3 4 5 6 Obs. Count 1685 1538 1651 1519 1490 1506 Nat'l % 8% 7% 8% 8% 8% 8% Expected 1525.6 1334.9 1525.6 1525.6 1525.6 1525.6 Month 7 8 9 10 11 12 Total Obs. Count 1607 1569 1662 1667 1548 1628 19070 Nat'l % 9% 9% 9% 9% 8% 9% 100% Expected 1716.3 1716.3 1716.3 1716.3 1525.6 1716.3 L! À The distribution of birth months for D1 players is the same as the distribution for the general population LE À The distribution of birth months for D1 players differs from the distribution for the general population This is a chi-square goodness of fit test with hypotheses as stated above. /B:/->/.Ñ œ Ð9,=/<@/. /B:/->/. "# Test Statistic: \ # œ œ # 3œ" Ð"')&"&#&Þ'Ñ# "&#&Þ' Ð"%*!"&#&Þ'Ñ# "&#&Þ' Ð"''#"("'Þ$Ñ# "("'Þ$ Ð"&$)"$$%Þ*Ñ# "$$%Þ* Ð"&!'"&#&Þ'Ñ# "&#&Þ' Ð"''("("'Þ$Ñ# "("'Þ$ Ð"'&""&#&Þ'Ñ# "&#&Þ' Ð"'!("("'Þ$Ñ# "("'Þ$ Ð"&%)"&#&Þ'Ñ# "&#&Þ' Ð"&"*"&#&Þ'Ñ# "&#&Þ' Ð"&'*"("'Þ$Ñ# "("'Þ$ Ð"'#)"("'Þ$Ñ# "("'Þ$ œ œ "'Þ'&& $!Þ*!" "!Þ$!) !Þ!#* !Þ)$" !Þ#&# 'Þ*'" "#Þ'%# "Þ(") "Þ%"' !Þ$#* %Þ&%$ œ )'Þ&)# degrees of freedom œ "# " œ ""; from ;# table, ;#Þ!& œ "*Þ'(&. Since )'Þ&)# "*Þ'(&, we reject L! and conclude that the distribution of birth months for D1 basketball players differes from the distribution for the general population. In which months do the birth month distributions differ? To answer this, for each cell calculate 9,=/<@/./B:/->/. (these are frequently referred to as the cell residuals); the values are /B:/->/. Jan 4.081 Feb 5.559 Mar 3.211 Apr -0.169 May -0.911 June -0.502 July -2.638 Aug -3.556 Sept -1.311 Oct -1.190 Nov 0.573 Dec -2.131 ST 372 Lecture Worksheet 11 page 2 It appears that the months in which more D1 basketball players are born compared to the general population are Jan, Feb, Mar. The months in which fewer D1 basketball players are born compared to the general population are July, Aug, and, to a lesser extent, Dec. 2. An urban economist want to determine whether the region of the US a resident lives in is associated with their general level of satisfaction with life. He randomly selects 150 residents 18 years of age or older from 4 geographic regions of the US: East, South, Midwest, and West. He asks: “are you satisfied or dissatisfied with the way things are going in the United States at this time?” Satisfaction Satisfied Dissatisfied Total East 77 73 150 South 84 66 150 Midwest 93 57 150 West 83 67 150 Total 337 263 600 L! À Satisfaction ratings are the same for all four regions LE : Satisfaction ratings are not the same in all four regions This is a chi-square test of homogeneity with hypotheses as stated above. /B:/->/.Ñ œ Ð9,=/<@/. /B:/->/. ) Test Statistic: \ # # 3œ" ‡ -96?78 >9>+6 The expected count in each cell is <9A >9>+6 . 1<+8. >9>+6 The table below shows the observed and expected counts in each cell: Satisfaction East South Midwest West Total Satisfied 77 (84.25) 84 (84.25) 93 (84.25) 83 (84.25) 337 Dissatisfied 73 (65.75) 66 (65.75) 57 (65.75) 67 (65.75) 263 Total 150 150 150 150 600 /B:/->/.Ñ œ Ð9,=/<@/. /B:/->/. ) Test Statistic: \ # # 3œ" œ Ð(()%Þ#&Ñ# )%Þ#& Ð($'&Þ(&Ñ# '&Þ(& Ð)%)%Þ#&Ñ# )%Þ#& Ð'''&Þ(&Ñ# '&Þ(& Ð*$)%Þ#&Ñ# )%Þ#& Ð&('&Þ(&Ñ# '&Þ(& Ð)$)%Þ#&Ñ# )%Þ#& Ð'('&Þ(&Ñ# '&Þ(& œ !Þ'#$* !Þ!!!( !Þ*!)) !Þ!")& !Þ(**% !Þ!!"! "Þ"'%% !Þ!#$) œ $Þ&%!& degrees of freedom œ (2 ")*(4 1) œ $; from ;# table, ;#Þ!& œ (Þ)"&. Since $Þ&%!& (Þ)"&, we .9 89> reject L! ; there is no evidence that the distributions of satisfaction ratings differ significantly from region to region.


