Test 6B
advertisement
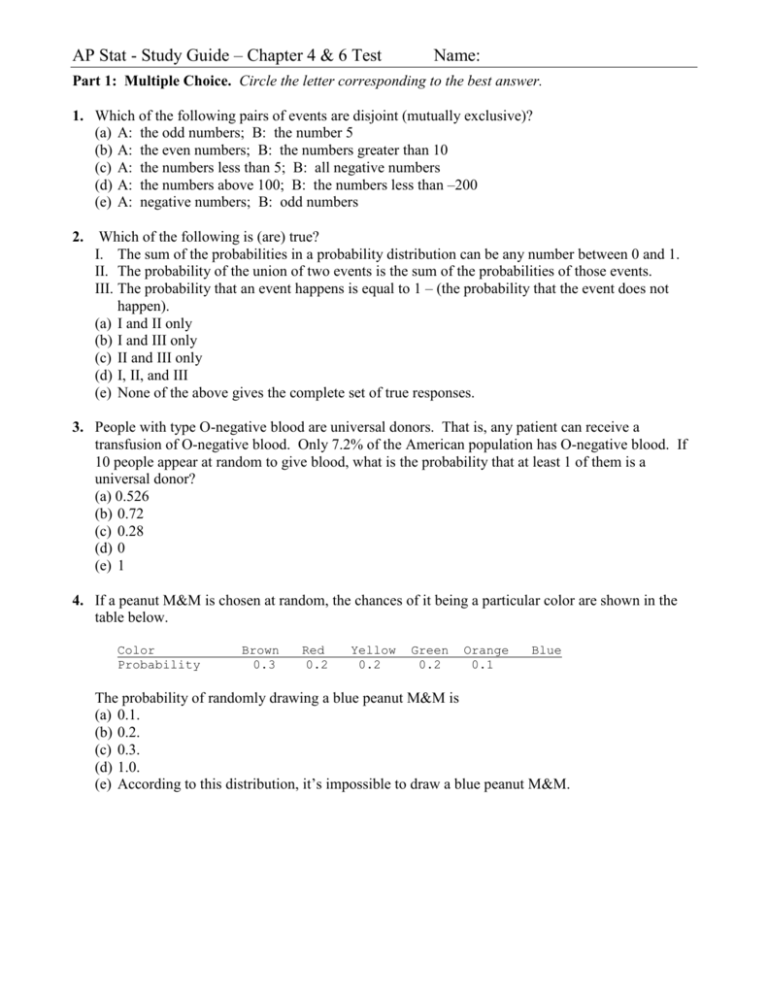
AP Stat - Study Guide – Chapter 4 & 6 Test Name: Part 1: Multiple Choice. Circle the letter corresponding to the best answer. 1. Which of the following pairs of events are disjoint (mutually exclusive)? (a) A: the odd numbers; B: the number 5 (b) A: the even numbers; B: the numbers greater than 10 (c) A: the numbers less than 5; B: all negative numbers (d) A: the numbers above 100; B: the numbers less than –200 (e) A: negative numbers; B: odd numbers 2. Which of the following is (are) true? I. The sum of the probabilities in a probability distribution can be any number between 0 and 1. II. The probability of the union of two events is the sum of the probabilities of those events. III. The probability that an event happens is equal to 1 – (the probability that the event does not happen). (a) I and II only (b) I and III only (c) II and III only (d) I, II, and III (e) None of the above gives the complete set of true responses. 3. People with type O-negative blood are universal donors. That is, any patient can receive a transfusion of O-negative blood. Only 7.2% of the American population has O-negative blood. If 10 people appear at random to give blood, what is the probability that at least 1 of them is a universal donor? (a) 0.526 (b) 0.72 (c) 0.28 (d) 0 (e) 1 4. If a peanut M&M is chosen at random, the chances of it being a particular color are shown in the table below. Color Probability Brown 0.3 Red 0.2 Yellow 0.2 Green 0.2 Orange 0.1 Blue The probability of randomly drawing a blue peanut M&M is (a) 0.1. (b) 0.2. (c) 0.3. (d) 1.0. (e) According to this distribution, it’s impossible to draw a blue peanut M&M. 5. c c If AB = S (sample space), P(A and B ) = 0.25, and P(A ) = 0.35, then P(B) = (a) 0.35. (b) 0.4. (c) 0.65 (d) 0.75. (e) None of the above. The answer is ________________. Government data give the following counts of violent deaths in a recent year among people 20 to 24 years of age by sex and cause of death: Accidents Homicide Suicide Female 1818 457 345 Male 6457 2870 2152 Questions 6 to 9 are based on this table. 6. Choose a violent death in this age group at random. The probability that the victim was male is about (a) 0.81. (b) 0.78. (c) 0.59. (d) 0.46. (e) 0.19. 7. The conditional probability that the victim was male, given that the death was accidental, is about (a) 0.46. (b) 0.48. (c) 0.56. (d) 0.78. (e) 0.81. 8. The conditional probability that the death was accidental, given that the victim was male, is about (a) 0.81. (b) 0.56. (c) 0.78. (d) 0.48. (e) 0.46. 9. Let A be the event that a victim of violent death was a woman and B the event that the death was a suicide. The proportion of suicides among violent deaths of women is expressed in probability notation as (a) 0.132. (b) 0.138. (c) P(A and B). (d) P(A | B). (e) P(B | A). 10. The chances that you will be ticketed for illegal parking on campus are about 1/3. During the last nine days, you have illegally parked every day and have NOT been ticketed (you lucky person!). Today, on the 10th day, you again decide to park illegally. The chances that you will be caught are (a) greater than 1/3 because you were not caught in the last nine days. (b) less than 1/3 because you were not caught in the last nine days. (c) still equal to 1/3 because the last nine days do not affect the probability. (d) equal to 1/10 because you were not caught in the last nine days. (e) equal to 9/10 because you were not caught in the last nine days. 11. I measure a response variable Y at each of several times. A scatterplot of log Y versus time of measurement looks approximately like a positively sloping straight line. We may conclude that (a) the correlation between time of measurement and Y is negative, since logarithms of positive fractions (such as correlations) are negative. (b) the rate of growth of Y is positive but slowing down over time. (c) an exponential curve would approximately describe the relationship between Y and time. (d) a power function would approximately describe the relationship between Y and time. (e) A mistake has been made. It would have been better to plot log Y versus the logarithm of time. Part 2: Free Response Answer completely, but be concise. Write sequentially and show all steps. 12. A statistics teacher collected some data on the age (in years) and price (in dollars) of some used Toyota Corollas from his local newspaper. The Fathom screen shot displays a scatterplot with the least-squares regression line superimposed, and a residual plot. a. How well does the linear model fit these data? Justify your answer. b. We used Fathom to transform the data and to produce the two screen shots below. Would an exponential model or a power model provide a better description of the relationship between age and price? Justify your answer. c. Use the model you chose in Question 2 to predict the price of a 4-year-old Toyota Corolla. Show your method. 13. A box contains six red tags numbered 1 through 6 and four white tags numbered 1 through 4. One tag is drawn at random. (a) Write the sample space for this experiment. Calculate the following probabilities: (b) P(red) (c) P(even number) (d) P(red and even) (e) P(red or even) (f) P(neither red nor even) (g) P(even | red) (h) P(red | even) (i) P( <4 | odd) 14. Suppose that for a group of consumers, the probability of eating pretzels is 0.75 and that the probability of drinking Coke is 0.65. Further suppose that the probability of eating pretzels and drinking Coke is 0.55. Determine if these two events are independent. 15. Here is the assignment of probabilities that describes the age (in years) and the sex of a randomly selected American student. Age Male Female 14-17 0.01 0.01 18-24 0.30 0.30 25-34 0.12 0.13 ≥35 0.04 0.09 (a) What is the probability that the student is a female? (b) What is the conditional probability that the student is a female, given that the student is at least 35 years old? (c) What is the probability that the student is either a female or at least 35 years old? 16. If three dice are rolled, find the probability of getting triples (that is, 1,1,1 or 2,2,2 or 3,3,3, etc.). 17. If four cards are drawn from a standard deck of 52 playing cards and not replaced, find the probability of getting at least one heart.
