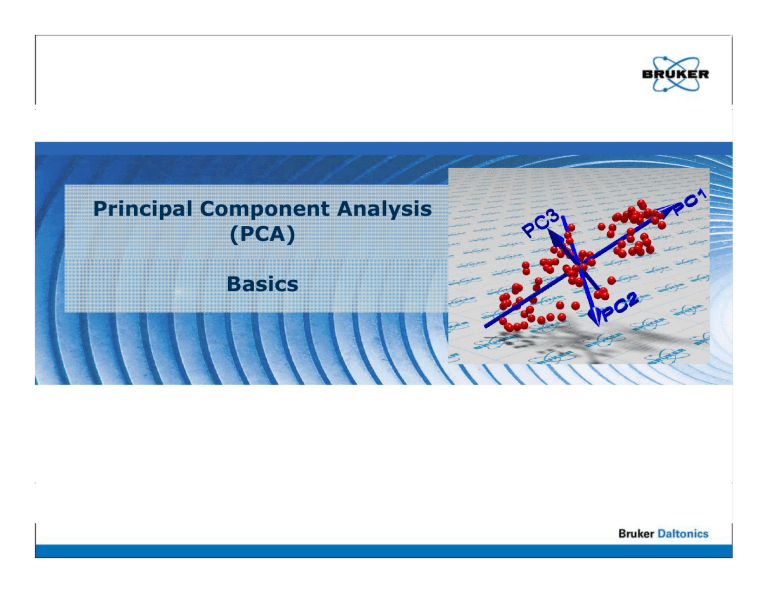
Principal Component Analysis (PCA) Basics
advertisement

Principal Component Analysis (PCA) Basics PCA We start with this set of spectra, e.g. individual pixels from a MALDI image Are there relationships between the spectra? Hard to tell.... PCA = A spectrum with n peaks can be plotted in a n-dimensional n dimensional space. The two pictures are equivalent PCA = So these two pictures are equivalent..... PCA Click and wait for animation Now we just contemplate over this image... PCA The PCA transforms the original g coordinate system: y The new coordinates are called principal components Rules: The origin of the new coordinate system is located in the center of the datapoints The first PC points in the direction of highest g variance The second PC points in the and direction of secondClick highest variance wait for …and so on animation The coordinates stay perpendicular Is there no better coordinate system? PCA Click and wait for animation PCA We now see: One dimension (PC3) contributes almost nothing to the information in the dataset PCA Variance plot 100% The variance plot shows how much variance in the dataset is explained by which PC (as bar) and how much variance is explained p by y the first n PCs (as line) 0% PC1 PC2 PC3 PCA Variance plot 100% By removing the PCs that contribute little to the variance, we project the entire dataset to a lower dimensional space, but retain most of the information 0% X PC1 PC2 PC3 PCA This is how we started This is what we got Simplification ! PCA The values that the spectra have in the PCPC coordinate system are called scores PCA So this representation is called a scores plot PCA in MALDI Imaging And each imaging, spectrumthe In MALDI (pixel) that scores sco es is for oassigned a se selected ec ed color l are translated in PC colors PCA „There seem to be clusters – does the PCA tell me which spectra belong together ?“ ? No, for this a clustering is needed! (e.g. hierarchical clustering) PCA „I always see different colors for different plot,, is the PCA not a classes in the scores p classification?“ No, the PCA is not a classification, but it can be used as the basis of an classifiaction „So, So where do the colors come from? from?“ PCA If we know that the spectra belong to different classes, we can give each spectrum a color that represents its class… PCA The colors are pre-existing knowledge …. and each spectrum keeps its color in the process The loadings • Because the PCA is a transformation of the old coordinate system (peaks) into the new coordinate system (PC), it can be estimated how much each of the old coordinates d (peaks) contribute to each of the new ones (PCs). • These values Th l are called ll d loadings. l di Th The hi higher h the th loading of a particular peak onto a PC, the more it contributes to that PC. The loadings plot Scores plot Loadings plot Each datapoint in the scores plot represents a spectrum Each point in the corresponding loadings plot represents a peak If we want to know which peaks seperate the red spectra from the others We look which peaks define that direction Limitiations • There is no guarantuee that the different classes are p in the PCA-space. p separated • If e.g. the sample-to-sample variation is much higher than a subtle difference between the classes, the PCA may even level out these differences. differences • In such cases supervised approaches are better • If there are less samples than dimensions (e.g. 100 spectra with 200 peaks), the PCA is technically not possible. The implementations of the PCA can deal with this based on some assumptions. ti There Th iis no guarantuee t that th t the th result lt is valid. Conclusion The PCA is a tool to reduce multidimensional data to lower dimensions while retaining most of the information www bdal com www.bdal.com


![See our handout on Classroom Access Personnel [doc]](http://s3.studylib.net/store/data/007033314_1-354ad15753436b5c05a8b4105c194a96-300x300.png)

