Karlsen, K.H., 2010: “Pricing of financial derivatives”, In: W. Østreng (ed): Transference. Interdisciplinary Communications 2008/2009, CAS, Oslo.
(Internet publication, http://www.cas.uio.no/publications_/transference.php, ISBN: 978-82-996367-7-3)
PRICING OF FINANCIAL DERIVATIVES
KENNETH H. KARLSEN
1. Introduction
A financial derivative, for example an option, is an instrument (contract) whose value depends on
the values of some underlying variables, where the underlying can be a commodity, an interest rate,
stock, a stock index, a currency, to mention just a few examples. The financial derivatives market
is enormous and is regularly reported to be worth $500 trillion. Derivatives provide an efficient way
to reduce risk related to changes in the value of the underlying variable. Once a financial derivative
is defined the first question is the following: “what is the fair price that the seller of the derivative
should charge to the buyer?” Eventually this question is answered, at least for options, by the
so-called Black and Scholes formula. The purpose of this short note is to display in very simplified
contexts the main underlying argument leading up to the fair price of a derivative, namely that
markets eliminate any opportunity for risk-free profits (the principle of no arbitrage).
2. Forward (futures) contracts
Forward contracts amount to the simplest example of a financial derivative. A forward contract
is an agreement between two parties in which one party agrees to buy or sell an asset at a fixed
time in the future for a particular price that they agree upon today.
The price that the underlying asset is bought or sold for is called the delivery price. This price
must be “fair”, i.e., it must be chosen so that the value of the contract to both parties is zero at the
onset. This is the principle of “no arbitrage” (arbitrage means taking advantage of price differences
in two markets). Let us illustrate by an example.
Let us assume that I enter into a forward in which I agree to sell 100 ounces of gold at $300 per
ounce in one year’s time. The payoff from this contract depends on the actual price of gold on the
delivery date. If the price of a gold is $350 at the end of the year, I make a loss on the transaction
because I have to buy 100 ounces of gold at $350 per ounce to meet my obligation to deliver the
gold (assuming I do not own the gold myself). On delivery I receive $300 per ounce, a total loss of
$5000 plus the delivery costs. On the other hand if the gold price went down to $250 per ounce, I
make a profit of $5000.
In general, if we denote the delivery price by K and S is the current price of gold at the time of
delivery (or any other underlying asset) the payoff is
K −S
per ounce of gold if I have agreed to sell gold at a fixed price, in which case I have taken a “short
position” in gold. Similarly, the payoff is
S−K
per ounce of gold if I have agreed to buy gold at a fixed price, in which case I have taken a “long
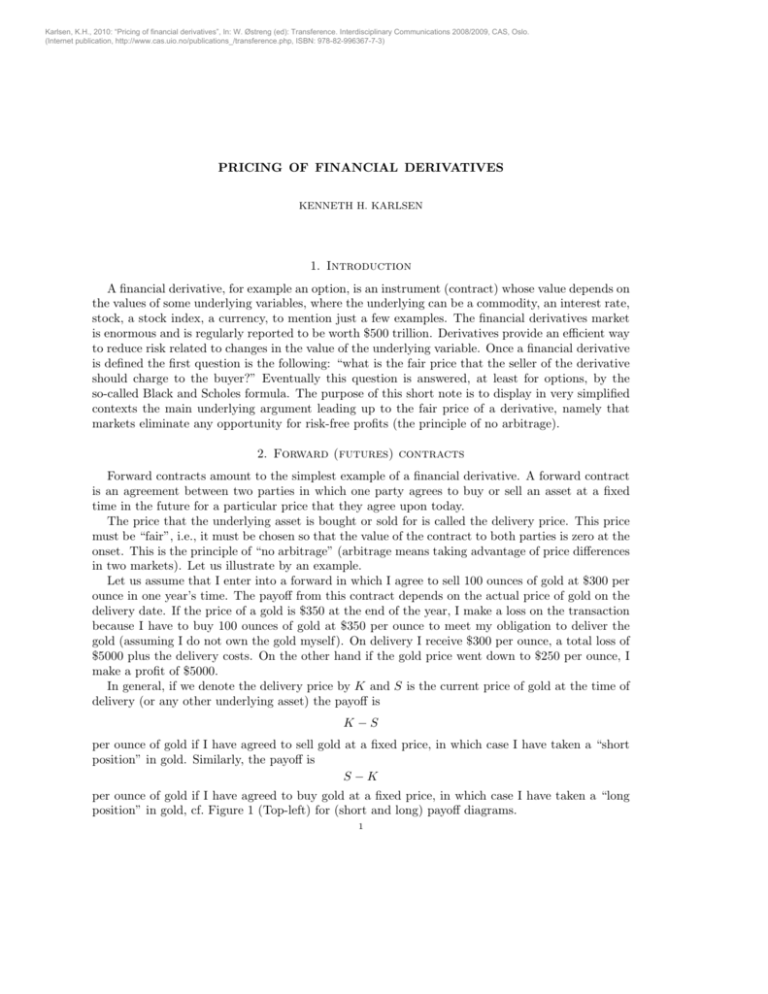
position” in gold, cf. Figure 1 (Top-left) for (short and long) payoff diagrams.
1
2
KENNETH H. KARLSEN
The question now is how do we determine a fair (no-arbitrage) delivery price that both parties
can agree upon. To this end, let us consider two investment strategies, which assume that I can
deposit or borrow money from the bank at 5 % per annum.
Strategy 1. If the current price of gold is $300 per ounce and the forward price of gold is $330
per ounce we can do the following:
1. Borrow $300 at 5% interest.
2. Buy one ounce of gold (price $300).
3. Enter into a short forward to sell one ounce of gold for $330 in one year’s time.
4. After one year we sell the gold for $330, and repay the bank of $300 plus $15 interest.
Hence, we made a profit of $15 without taking any risk! As a matter of fact, any delivery price
above $315 will result in a risk free profit using this strategy.
Strategy 2. Likewise if the delivery price is below $315, say $310, we can do the following:
1. Sell one ounce of gold for $300.
2. Deposit $300 in the bank at 5% interest.
3. Enter into a forward to buy one ounce of gold in one year’s time for the delivery price ($310).
4. After one year we buy one ounce of gold for the delivery price ($310).
Hence, we made a profit of $5, again without taking any risk! Indeed, as long as the delivery
price is under $315 there is a risk free profit to be made.
Of course, investors in the gold market will take advantage of any forward price that is not equal
to $315, eventually bringing the price to $315, which is known as the fair or arbitrage free price
(since other prices yield arbitrage opportunities).
Before ending this brief discussion about forward contracts, it should be stressed that these
contracts are one-sided in the sense that the sum of the payoffs of the two parties is zero, that is,
for every winner there is a loser. This illustrates the speculative nature of this instrument when
traded in isolation. However, there is a variety of ways in which forward contracts can be used to
reduce risk (known as “hedging”). For example, forward contracts are frequently used to hedge
currency movements.
For an introduction to futures we refer to [2].
3. Options
A more interesting and complicated type of financial derivative is an option. In this contract one
of the parties has the option, but not the obligation, to buy or sell an underlying asset (say stock)
for a fixed price at a fixed time in the future, where “buy” refers to a a call option and “sell” to a
put option. Different from the forward contracts, these instruments are one-sided in the sense that
the holder has the option but not the obligation to buy or sell.
Suppose I buy a call option on Telenor giving me the option to buy 100 shares in 3 months time
for $6 per share, with the current price being $6. On one hand, if after 3 months the share price is
below $6 there is no point in exercising the option. On the other hand, if the share price is above $6,
the option will be exercised. More specifically, if the share price is $6.5, I would exercise the option
and buy the 100 shares for $6 a share and then immediately sell them for $6.5 a share, yielding a
payoff of $50. The net profit would be $50 minus the price (premium) I pay for the option. More
PRICING OF FINANCIAL DERIVATIVES
3
generally,
profit = payoff − C,
payoff = max(S − K, 0),
where S is the price of the underlying share (Telenor) at the time of exercise, K is the strike price,
and C the call option premium. Observe that when S is less than K, the option would not be
exercised. Similarly, the profit / payoff for a put option is given by
profit = payoff − P,
payoff = max(K − S, 0),
where P is the price of the put option (premium), cf. the profit diagrams in Figure 1 (Top-right).
As with forward contracts, buying and selling options in isolation is a risky business. In particular, there is a potentially unlimited loss associated with writing an option. Instead, options should
be used for hedging purposes. Suppose I have a portfolio consisting of 100 Telenor shares currently
worth $600. I worry that they will fall dramatically in value. However, I can hedge my exposure to
changing share prices by buying a put option with strike K = $6 per share, allowing me to sell 100
shares in three months time for $600. By enlarging my portfolio with a put option I am effectively
introducing a lower bound on the value of my portfolio, i.e., on the amount of money that I can
loose, cf. Figure 1 (Bottom-left). This is a kind of insurance for which I have to pay a premium
(the option price). Now the crucial question is the following: what is the option price that makes
the option seller willing to undertake all the risk?
This question was rigorously answered by Fisher Black (financial professional) and Myron Scholes
(finance professor). They developed a differential equation whose solution, known as the BlackScholes formula, gives the fair (arbitrage free) price of a call or put option. For a detailed derivation
of the Black-Scholes formula, we refer to [1, 2, 3].
In the remaining part of this paper we will discuss the underlying principle that eventually leads
to this formula. We will restrict ourselves to a very simplified discrete-time context. The pricing of
an option revolves around two components: one is called the “intrinsic value” and the other is called
the “time value”, cf. Figure 1 (Lower-right). The intrinsic value is the value that the option would
have if it were exercised today, i.e., the true worth of your option at present. The time value of
the option is the difference between the option value and its intrinsic value. Basically, it represents
the risk premium that the option seller needs in order to provide the buyer with the right to buy
or sell the share at the exercise date. The actual derivation of time value is the difficult part in
determining the value of an option, and it depends largely on the volatility of the stock.
To better understand how to value an option, let us consider a one-period stock price model
S = (S0 , S1 ) and a call option with strike K = $100. Suppose a stock currently sells for S0 = $100
at time T0 . At time T1 the stock will either rise to $120 or fall to $80. The probabilities that the
stock price will rise and fall are respectively 3/4 and 1/4. If the stock price rises, the call will have
a payoff of S1 − K = $20, while a fall in the stock price results in the call expiring worthless.
The expected value of buying the option (expected payoff) is $20 34 + $0 41 = $15. It natural to
assume that this must be the fair price of the call option. Indeed, this is the approach that has
been used in actuarial mathematics for centuries. However, it can be shown by contradiction this
is not the case (the difference between the market price of an option and its expected value is often
called the “risk premium”). To this end, let us assume (without loss of generality) that it is possible
to borrow money from the bank without paying interest. Suppose I sell a call to a buyer for its
expected value of $15. I then borrow $40 from the bank, bringing my total amount of money up
to $55. I use $50 to buy 21 of a share of the stock underlying the call, while the remaining $5 is
saved. At time T1 there are two possible outcomes: Outcome 1 (stock price rises to S1 = $120). I
sell my 21 share of stock for $60, and repays my $40 loan, leaving me with with $25. The buyer of
4
KENNETH H. KARLSEN
the call exercises the option to purchase the stock from me for $100. Once I receive $100 from the
call buyer, I immediately purchases the stock at its current market price of $120 and turn it over
to the call buyer, leaving me with $5 of profit. Outcome 2 (stock price falls to S1 = $80). The call
option of they buyer expires worthless. I sell my 21 share of stock, receiving $40 that is used to pay
off the loan. This leaves me with $5 of profit. To summarize, regardless of what happens with the
stock price, in this example I made $5 without taking any risk.
The prospect to make a risk-free profit is referred to as arbitrage. In a market with a large
number of rational participants, a situation like this will never exist for long and eventually the
price will be driven down by arbitrage until there is no risk-free profit to be made. Hence, the value
of the call option is not the value given by statistics (i.e., the expected value of $15) but rather $10.
If the option sells for more than $10, there will be call writers but not call buyers. If the option
sells for less, there will be call buyers, but no one willing to sell. Only when the price of the option
is $10 will the possibility of making risk free profit be eliminated. The Black-Scholes formula is
derived under the key assumption that there are no arbitrage opportunities in the market [1, 2, 3].
Although it is out of the scope of this short note to derive the Black-Scholes formula, let us
demonstrate how the modern (martingale approach to) no-arbitrage theory applies in the present
extremely simple example to find the price $10. Since the work by Black, Scholes, and Merton on
the pricing of options, the no arbitrage theory has played a key role in mathematical finance. The
connection between arbitrage arguments and martingale theory was later developed by Harrison,
Kreps, Pliska, and others.
To illustrate the martingale approach, let us recall that we are working in a single period stock
market S = (S0 , S1 ), where S0 = 100 and S1 = 120 with probability p = 34 and S1 = 80 with
probability 1 − p = 14 . The payoff of the call option is (S1 − K)+ = max(S1 − K, 0), where the
strike price is K = 100. First, as pointed out above, the expected payoff
Ep [(S− 100)+ ] = (120 − 100)+ p + (80 − 100)+ (1 − p) = 20p = 15
gives the wrong price. The modern no-arbitrage (martingale) approach goes as follows:
Step 1. Replace the “physical” probability p with an “artificial” probability q that turns the
the stock price into a martingale. In general, a discrete-time stock price process S is a martingale
provided the conditional expected value of the next observation, given the past observations, is equal
to the most recent past observation. In the present context this means that the expectation of S1
equals the expectation of S0 . More precisely, we determine q such that Eq [S1 ] = q120 + (1 − q)80
equals Eq [S0 ] = 100, which gives q = 12 .
Step 2. Calculate the arbitrage-free price c as an expectation of the payoff under q (NOT p):
c = Eq [(S1 − 100)+ ] = (120 − 100)+ q + (80 − 100)+ (1 − q) = 10!
The main feature of the modern pricing theory is that the price of a derivative prices is indeed
equal to the (discounted) expected value of the future payoff of the derivative, provided the expectation is computed, not under the “physical” probability p, but under a new a risk-neutral measure
q that turns the stock price process into a martingale. We refer to [1, 2, 3] more details.
References
[1] F. E. Benth. Option theory with stochastic analysis. Universitext. Springer-Verlag, Berlin, 2004.
[2] J. Hull. Options, futures, and other derivatives. Pearson/Prentice Hall, Upper Saddle River, N.J., 6th ed edition,
2006.
[3] B. Øksendal. Stochastic differential equations. Springer-Verlag, Berlin, 1998.
PRICING OF FINANCIAL DERIVATIVES
Payoff of forward contracts
tp
os
iti
g
n
Lo
on
K
po
tio
si
n
ll
or
Profit (payoff-premium) for call
Pu
Ca
Sh
5
t
K
S axis
S axis
Payoff
Share Put option Total
Time Value (TV)
K
Option value
Intrinsic Value (IV)
K
0
0
K / strike price
S / asset price
S
OTM
ATM
ITM
Figure 1. Top-left: payoff diagrams for forward contracts. Top-right: profit diagrams for options. Bottom-left: Profit diagram of Telenor portfolio enlarged with
a put option. Bottom-right: option / time value (OTM: Out-of-the-money, ITM:
In-the-money, OTM: Out-of-the-money).

