Department of Electronic and Information Engineering
advertisement
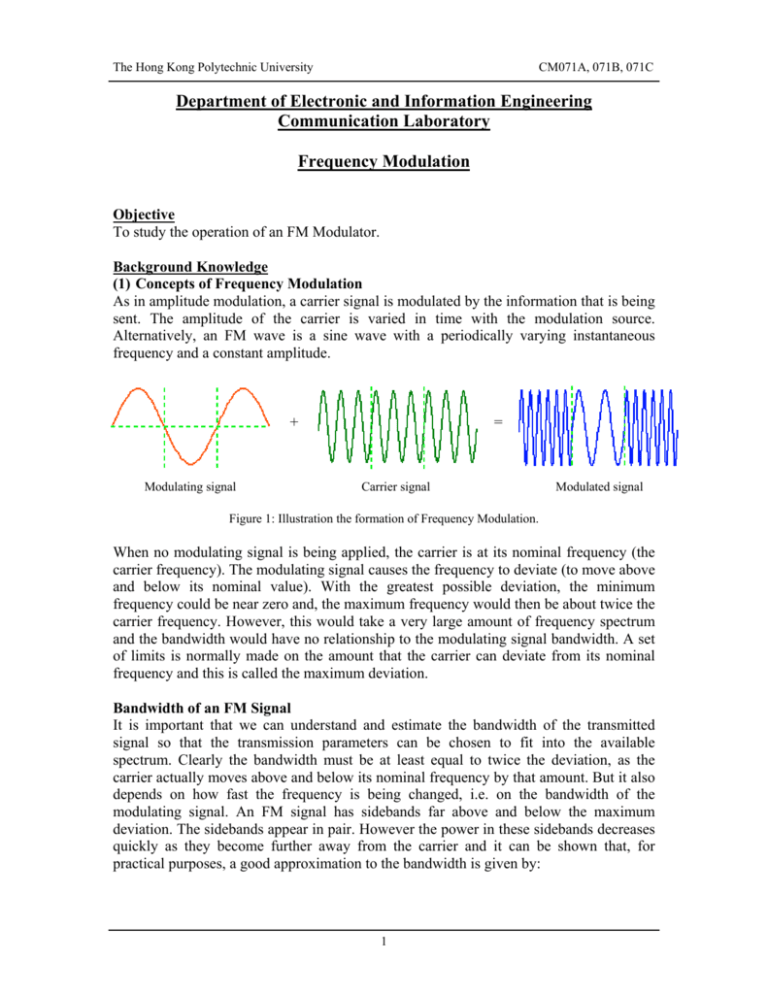
The Hong Kong Polytechnic University CM071A, 071B, 071C Department of Electronic and Information Engineering Communication Laboratory Frequency Modulation Objective To study the operation of an FM Modulator. Background Knowledge (1) Concepts of Frequency Modulation As in amplitude modulation, a carrier signal is modulated by the information that is being sent. The amplitude of the carrier is varied in time with the modulation source. Alternatively, an FM wave is a sine wave with a periodically varying instantaneous frequency and a constant amplitude. + Modulating signal = Carrier signal Modulated signal Figure 1: Illustration the formation of Frequency Modulation. When no modulating signal is being applied, the carrier is at its nominal frequency (the carrier frequency). The modulating signal causes the frequency to deviate (to move above and below its nominal value). With the greatest possible deviation, the minimum frequency could be near zero and, the maximum frequency would then be about twice the carrier frequency. However, this would take a very large amount of frequency spectrum and the bandwidth would have no relationship to the modulating signal bandwidth. A set of limits is normally made on the amount that the carrier can deviate from its nominal frequency and this is called the maximum deviation. Bandwidth of an FM Signal It is important that we can understand and estimate the bandwidth of the transmitted signal so that the transmission parameters can be chosen to fit into the available spectrum. Clearly the bandwidth must be at least equal to twice the deviation, as the carrier actually moves above and below its nominal frequency by that amount. But it also depends on how fast the frequency is being changed, i.e. on the bandwidth of the modulating signal. An FM signal has sidebands far above and below the maximum deviation. The sidebands appear in pair. However the power in these sidebands decreases quickly as they become further away from the carrier and it can be shown that, for practical purposes, a good approximation to the bandwidth is given by: 1 The Hong Kong Polytechnic University B=2 ( Fd + Fm ) CM071A, 071B, 071C where B is the bandwidth, Fd is maximum carrier frequency deviation, Fm is the modulation frequency. This is sometimes called Carson’s Rule, and the bandwidth B can be viewed as containing the majority of the transmitted power, certainly sufficient for successful demodulation. As we have seen, the bandwidth of an FM signal depends on both the deviation and the modulation bandwidth. It might be though that, in order to keep the bandwidth as narrow as possible, all FM systems should be operated with a very small deviation. However, there are significant advantages to operating with a wide deviation. The main one is an apparent improvement in noise performance. Actually, a specific bandwidth can be the result of wide deviation with a low modulation bandwidth or a narrow deviation with a large modulation bandwidth. The ratio of deviation to modulation bandwidth is called the modulation index and is an important parameter in describing an FM system. Modulation index is given by: β = Fd / Fm where β is the modulation index. In the practical, a frequency modulator is formed from a Voltage-Controlled Oscillator (VCO). A voltage is applied to it from a control on the hardware board and the oscillator output can be examined on the oscilloscope and spectrum analyser. Using this configuration, the fundamental concept of an oscillator frequency being changed by an external signal can be understood. (2) A Frequency Modulator In this practical, a sine wave signal is used to frequency-modulate a carrier so that you can investigate the appearance of such signals in both the time and frequency domains. You can adjust the amount of deviation and hence change the modulation index. Notice that the appearance of an FM signal on the spectrum analyser is similar to that of an AM signal when the modulation index is small. (3) FM Spectrum with a Large Modulation Index In this practical, the modulation frequency has been reduced to about 5kHz. Since the maximum deviation is the same as the previous practicals, the modulation index is much greater. From the equation B=2 ( Fd + Fm ), if Fm is small compared with Fd, then the modulation index is high and resulting in B=2Fd. On the analyser, the spectrum appears to be continuous but in reality it is made up of a large number of sidebands spaced at 5 kHz intervals from the carrier up to Fd. This practical simply shows how when the modulation index is large, the bandwidth is determined almost exclusively by the deviation. 2 The Hong Kong Polytechnic University CM071A, 071B, 071C Reference 1. Ferrel G. Stremler, Introduction to Communication Systems 3rd, Addison Wesley 2. Noise Reduction in Frequency Modulation http://www.arrakis.com.au/ais_users/tudor/signal/theory.html 3. Frequency Modulation http://www.rfcafe.com/references/electrical /frequency_modulation.htm 4. Angle Modulation http://www.williamson-labs.com/home.htm (select RF sub-topic) Equipment 1. PC Interface Box (RAT 53-100) 2. FM Board 53-140 3. Oscilloscope 4. Feedback Power Supply 01-100 5. PC with Discovery Software Preliminary Preparation 1. Connect the equipment as the following Figure 2 and DO NOT turn on any power at this moment. Oscilloscope Monitor Computer Keyboard Interface RAT 53-100 FM Board 53-140 Power Supply Figure 2: Setting. 2. Switch on the Oscilloscope and set it as follows: Vert. Amp 0.5V/Div Hori. Amp 5µs/Div 3. Turn on the Computer first and connect FM Board to the Interface before switching on the FEEDBACK Power Supply 01-100. Note: Connect the voltages of the FM Board to that of the Interface carefully, otherwise, the Board will be burnt! 4. In DOS Prompt mode, type <CD\FBTP> and then <START>. 5. Turn on the power. 6. Use the Mouse to click at the <System> in the Menu Bar and then select <Index>. 7. Click <3> in the list for Assignment 3 and then select <Yes> for this experiment. 8. Click at the <Practicals> in the Menu Bar, and select <Practical 1> for Practical 1 experiment and so on. 9. Click at <Conditions> in the Menu Bar and select <Spectrum Analyser>. 10. Click at <Conditions> in the Menu Bar and select <Change size>. Then the spectrum analyser will be in large size. 11. Use Channel 1 of the Oscilloscope to monitor any point on the FM Board. 3 The Hong Kong Polytechnic University CM071A, 071B, 071C Experimental Procedures & Questions (1) Practical 1 (Concepts of Frequency Modulation) In this part, you can see how the oscillator frequency can be controlled by an external signal. The hardware is configured as shown below: Oscilloscope 0.08 Volts dc Variable Voltage 16 Frequency Modulator 4 Figure 3: Practical 1 configuration. 1. 2. 3. 4. 5. 6. 7. 8. Select <Practical 1> from the <Practicals> menu in Assignment 3. Connect point <4> on the FM Board to the oscilloscope. Connect point <4> to the <spectrum analyser> on the monitor at the same time. Set the <carrier level> (or the <modulator output level>) to about half scale. Set the <manual frequency> to the minimum. Record the d.c. voltages at <16> displayed on the monitor. Record the time period at <4> from the oscilloscope. Record the frequency and the amplitude at <4> from the <spectrum analyser> with a large size on the monitor. 9. Increase the <manual frequency> and monitor at <16>. You can observe that the d.c. voltage applied is increasing. 10. Repeat step 5 to 8 for the different d.c. voltages and also complete the table below. d.c. voltage at <16> (in Volts) (min) Time Period at <4> (in µs) Frequency at <4> (in kHz) Amplitude at <4> (in dB) (half scale) 0.00 (max) Question 1: Use the column 2 of the above table to calculate the total frequency range of the oscillator. Question 2: What is the total frequency range of the oscillator obtained in the column 3 of the above table? Question 3: Is it easier to measure the frequency range on the oscillator or on the spectrum analyser? Question 4: Use the data obtained in the column 1 and the column 3 of the above table to calculate the “frequency slope” of the oscillator in kilohertz per volt. Question 5: Can you see any amplitude variation over the frequency range from the column 4 of the above table? Should there be any? 4 The Hong Kong Polytechnic University CM071A, 071B, 071C (2) Practical 2 (A Frequency Modulator) In this practical, the variable voltage used to control the VCO frequency has been replaced by a sine wave oscillator. This sine wave now frequency-modulates the carrier. Oscilloscope Modulation Source 3 Frequency Modulator 4 Figure 4: Practical 2 configuration. 1. 2. 3. 4. 5. Select <Practical 2> from the <Practicals> menu in Assignment 3. Set the <carrier level> on the FM Board to about half scale. Set the <modulation level> to the minimum. Look at the signal at <4> with the <oscilloscope> at large size. Increase the <modulation level> and observe that the frequency is changing. Note where the output at <4> has a higher frequency. Question 6: Draw the waveforms observed and decide where has a higher frequency. Question 7: As the modulation level varies, how constant are: a) the carrier-frequency component of the modulated signal? b) the amplitude of the modulated signal? 6. Monitor point <3> with the oscilloscope. 7. Adjust the <modulation level> and observe how the instantaneous frequency depends on the instantaneous value of the modulating signal. Question 8: Conclude the observation from point <3> and point <4>. 8. Connect point <4> to the <spectrum analyser> at large size in order to examine the sidebands of the signal. 9. Adjust the <modulation level> until only the sidebands at Fc – Fm and Fc+ Fm are present. It is a FM signal that has sidebands with low deviation. Question 9: Draw the spectrum with low frequency deviation and label Fc, Fc – Fm and Fc+ Fm. 10. Try to adjust the <modulation level> again until the higher-order sidebands appear at higher deviation, i.e. a larger modulation index. Question 10: Draw the spectrum with high frequency deviation and label Fc, Fc – Fm and Fc+ Fm. Question 11: Can you estimate the frequency of the modulating signal from the waveforms obtained? Explain briefly. Question 12: Would it be equally easy to estimate the bandwidth of the modulating signal from the spectrum if the modulating signal were complex, having many frequencies? 5 The Hong Kong Polytechnic University CM071A, 071B, 071C (3) Practical 3 (FM Spectrum with a Large Modulation Index) In this practical, the modulation index has been set to 5kHz. This means that the modulation index can be very high. This enables you to see that under these conditions the bandwidth of a FM signal is almost equal to twice the deviation. The hardware is configured as shown below: Figure 5: Practical 3 configuration. 1. Select <Practical 3> from the <Practicals> menu in Assignment 3. 2. Set the <Carrier level>to about half scale. 3. Turn the <5kHz level> up and down and observe the bandwidth changing. Note that the bandwidth is almost proportional to the frequency deviation. Question 13: Draw the spectrum observed. Question 14: If the modulating frequency is 5kHz and the frequency deviation is 50kHz, calculate the modulation index. Question 15: Calculate the signal bandwidth using Carson’s rule. Comment on the answer. Question 16: If a bandpass filter were to be added at the input of a FM detector, what is the bandwidth required? 6

