AP Statistics – Chapter 7 Test Standards
advertisement
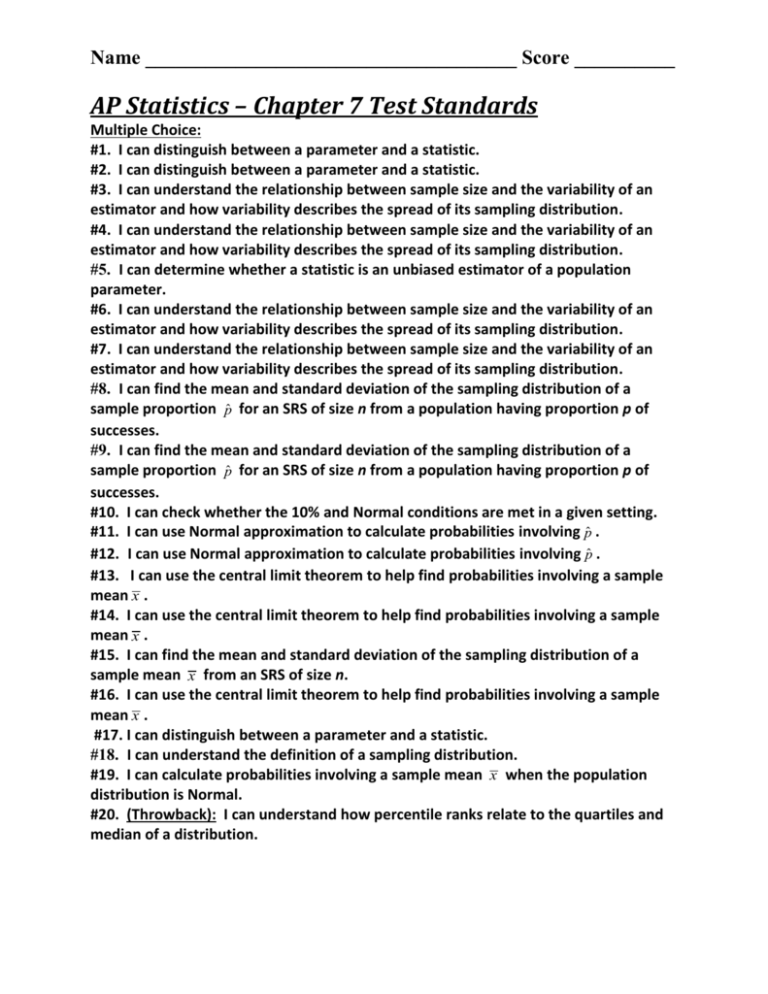
Name _____________________________________ Score __________ AP Statistics – Chapter 7 Test Standards Multiple Choice: #1. I can distinguish between a parameter and a statistic. #2. I can distinguish between a parameter and a statistic. #3. I can understand the relationship between sample size and the variability of an estimator and how variability describes the spread of its sampling distribution. #4. I can understand the relationship between sample size and the variability of an estimator and how variability describes the spread of its sampling distribution. #5. I can determine whether a statistic is an unbiased estimator of a population parameter. #6. I can understand the relationship between sample size and the variability of an estimator and how variability describes the spread of its sampling distribution. #7. I can understand the relationship between sample size and the variability of an estimator and how variability describes the spread of its sampling distribution. #8. I can find the mean and standard deviation of the sampling distribution of a sample proportion p̂ for an SRS of size n from a population having proportion p of successes. #9. I can find the mean and standard deviation of the sampling distribution of a sample proportion p̂ for an SRS of size n from a population having proportion p of successes. #10. I can check whether the 10% and Normal conditions are met in a given setting. #11. I can use Normal approximation to calculate probabilities involving p̂ . #12. I can use Normal approximation to calculate probabilities involving p̂ . #13. I can use the central limit theorem to help find probabilities involving a sample mean x . #14. I can use the central limit theorem to help find probabilities involving a sample mean x . #15. I can find the mean and standard deviation of the sampling distribution of a sample mean x from an SRS of size n. #16. I can use the central limit theorem to help find probabilities involving a sample mean x . #17. I can distinguish between a parameter and a statistic. #18. I can understand the definition of a sampling distribution. #19. I can calculate probabilities involving a sample mean x when the population distribution is Normal. #20. (Throwback): I can understand how percentile ranks relate to the quartiles and median of a distribution. Name _____________________________________ Score __________ *Note: The questions on the actual test may or may not be presented in this exact order. Free Response #1 (Standards and Scoring Criteria): Part 1: I can find the mean and standard deviation of the sampling distribution of a sample proportion p̂ for an SRS of size n from a population having proportion p of successes. I can check whether the 10% and Normal conditions are met in a given setting. Student must be able to correctly identify the mean of a sample proportion and write the answer using the correct symbols. Student must be able to correctly communicate the applicable condition. Student must be able to use the results of the applicable condition and explicitly state the conclusion that can be drawn. Part 2: I can find the mean and standard deviation of the sampling distribution of a sample proportion p̂ for an SRS of size n from a population having proportion p of successes. I can check whether the 10% and Normal conditions are met in a given setting. Student must be able to correctly identify the mean of a sample proportion and write the answer using the correct symbols. Student must be able to correctly communicate the applicable condition. Student must be able to use the results of the applicable condition and explicitly state the conclusion that can be drawn. Part 3: I can use Normal approximation to calculate probabilities involving p̂ . I can use the sampling distribution of p̂ to evaluate a claim about a population proportion. Student must correctly communicate the probability that is to be computed by using proper symbols throughout the calculation. Student must correctly calculate the probability (arriving at the correct final answer). Part 4: I can use Normal approximation to calculate probabilities involving p̂ . I can understand the relationship between sample size and the variability of an estimator. Student must correctly communicate the probability that is to be computed by using proper symbols throughout the calculation. Student must correctly calculate the probability (arriving at the correct final answer). Student must correctly be able to communicate how sample size will affect variability. Name _____________________________________ Score __________ Free Response #2 (Standards and Scoring Criteria): Part 1: I can find the mean and standard deviation of the sampling distribution of a sample mean x from an SRS of size n. I can check whether the 10% and Normal conditions are met in a given setting. Student must be able to correctly calculate the standard deviation of a sampling distribution and write the answer using the correct symbols. Student must be able to correctly communicate the applicable condition and use the results of the applicable condition and explicitly state the conclusion that can be drawn. Part 2: I can check whether the 10% and Normal conditions are met in a given setting. I can explain how the shape of the sampling distribution of x is related to the shape of the population distribution. I can use the central limit theorem to help find probabilities involving a sample mean x . Student must be able to correctly communicate the applicable condition and use the results of the applicable condition and explicitly state the conclusion that can be drawn. Student must correctly communicate the probability that is to be computed by using proper symbols throughout the calculation. Student must correctly calculate the probability (arriving at the correct final answer). Part 3: I can use the central limit theorem to help find probabilities involving a sample mean x . Student must correctly communicate the probability that is to be computed by using proper symbols throughout the calculation. Student must correctly calculate the probability (arriving at the correct final answer). Part 4: I can determine whether a statistic is an unbiased estimator of a population parameter. I can understand the relationship between sample size and the variability of an estimator. Student must be able to give a general “yes” or “no” answer correctly based on the question. Student must be able to properly communicate the results for the “yes” or “no” answer to the question.


