Marine Geology 264 (2009) 258–261
Contents lists available at ScienceDirect
Marine Geology
j o u r n a l h o m e p a g e : w w w. e l s ev i e r. c o m / l o c a t e / m a r g e o
Discussion
Comment on “Wave climate, sediment supply and the depth of the sand–mud
transition: A global survey” by D.A. George and P.S. Hill
[Marine Geology 254 (2008) 121–128]
Jorge Guillén a,c,⁎, José A. Jiménez b,c
a
b
c
Institut de Ciències del Mar (C.S.I.C.), Passeig Marítim de la Barceloneta, 37–49, 08003 Barcelona, Spain
Laboratori d'Enginyeria Marítima, ETSECCPB, Universitat Politécnica de Catalunya, c/. Jordi Girona 1–3, Campus Nord ed. D1, 08034 Barcelona, Spain
Unidad Asociada UPC-CSIC Geología, Morfodinámica y Gestión Costera, Barcelona, Spain
a r t i c l e
i n f o
Article history:
Received 1 April 2009
Received in revised form 22 April 2009
Accepted 23 April 2009
Communicated by J.T. Wells
Keywords:
Sand–mud transition
Ebro continental shelf
Wave energy
Bed shear stress
a b s t r a c t
An extensive dataset of sediment grain size and wave conditions in the Ebro Delta (NW Mediterranean)
is used to verify the local scale applicability of the work of George and Hill (George, D.A., Hill, P.S., 2008.
Wave climate, sediment supply and the depth of the sand–mud transition: a global survey. Mar. Geol., 254,
121–128) on the definition of the sand–mud transition (SMT). The proposal of using either a mean grain size
of 63 μm or a mud content of 25% to define the presence of the sand–mud transition was locally verified (96%
well-classified of a total of 382 samples). However, determining the depth of the sand–mud transition (hSMT)
based only on the wave height shows several practical and conceptual inconsistencies that could be partially
solved by including the wave period into the equation. On the Ebro Delta shelf, the use of the across-shelf
distribution of skin friction accurately predicts the hSMT.
© 2009 Elsevier B.V. All rights reserved.
1. Introduction
This note is a comment on the paper by George and Hill (2008),
hereafter referred to as GH08, which proposes a method for predicting
the depth of the sand–mud transition (hSMT) of wave-dominated
shelves. First, GH08 defined the sand–mud transition (SMT) as the
boundary where mean grain size is 63 μm or the percentage of mud is
25%. Second, it compiled the depth of sand–mud transition from 17
sedimentary systems around the world to establish the linear
relationship between hSMT and the mean significant wave height (Hs).
The definition of a simple, general and statistically significant
relationship between the sediment grain-size distribution across
coastal shelves and some parameters characterizing environmental
conditions has been tackled in different ways, based on the assumption
of the existence of an equilibrium distribution (Niedoroda et al., 1985;
Larson, 1991; Horn, 1992; Dunbar and Barrett, 2005). The method
proposed by GH08 is, in fact, one specific application of the across-shelf
equilibrium grain size distribution. Results of GH08 indicate that the
hSMT of wave-dominated shelves can be reasonably predicted
(r2 = 0.84) using Hs. However, the calculated relationship gives a
DOI of original article: 10.1016/j.margeo.2008.05.005.
⁎ Corresponding author. Institut de Ciències del Mar (C.S.I.C.), Passeig Marítim de la
Barceloneta, 37–49, 08003 Barcelona, Spain. Tel.: +34 932309600.
E-mail address: jorge@icm.csic.es (J. Guillén).
0025-3227/$ – see front matter © 2009 Elsevier B.V. All rights reserved.
doi:10.1016/j.margeo.2009.04.004
range of variation of hSMT of about 40 m with a 95% confidence interval
(Fig. 5 of GH08). This means that a predicted hSMT of 25 m water depth
could range between 5 and 45 m water depth with a 95% confidence
interval. Furthermore, the observed hSMT of sedimentary systems used
to establish the equation ranged between 5 and 55 m water depth.
Therefore, the predictive and general character of the equation is
doubtful, suggesting that additional parameters should be taken into
account to improve the fit. Secondary parameters influencing the
location of the hSMT are hardly discussed by GH08, although they do
mention the potential influence of sediment loads from rivers, shelf
width and slope, currents and shoaling transformations of waves. They
also finally recognize that storm wave parameters may be more
appropriate than mean wave parameters for predicting hSMT.
The objective of this note is to carry out a site-specific, highly
detailed verification of the global equation proposed by GH08 to
evaluate its small/local scale applicability and to introduce new
insights into some of the secondary parameters that the paper
mentions (mainly wave characterization). The extensive data set
(sediment texture and waves) existing in the Ebro Delta area (NW
Mediterranean), one of the study sites used in the GH08 paper, is used
for this discussion. The specific points to be addressed are: 1) the
equivalence between mean grain size and mud content as proposed
by GH08 to define the sand–mud transition, 2) the accuracy of the
GH08 hSMT prediction method at a small scale, and 3) the implications
of using Hs to predict hSMT.
J. Guillén, J.A. Jiménez / Marine Geology 264 (2009) 258–261
259
2. Depth of the sand–mud transition in the Ebro Delta
The spatial distribution and temporal changes of grain size of
surface sediment around the Ebro Delta was described by Díaz et al.
(1996) and Guillén and Palanques (1997) using the sediment samples
illustrated in Fig. 1. Those authors identified the sand–mud transition
(mean grain size = 63 μm) in the delta at a water depth between 6 and
18 m, depending on the location along the delta coast. The shallowest
locations of the SMT are located at the present river mouth and at both
sides of the northern and southern spits, whereas the deepest ones are
in shelf areas influenced by the presence of ancient delta lobes
(Guillén and Palanques, 1997).
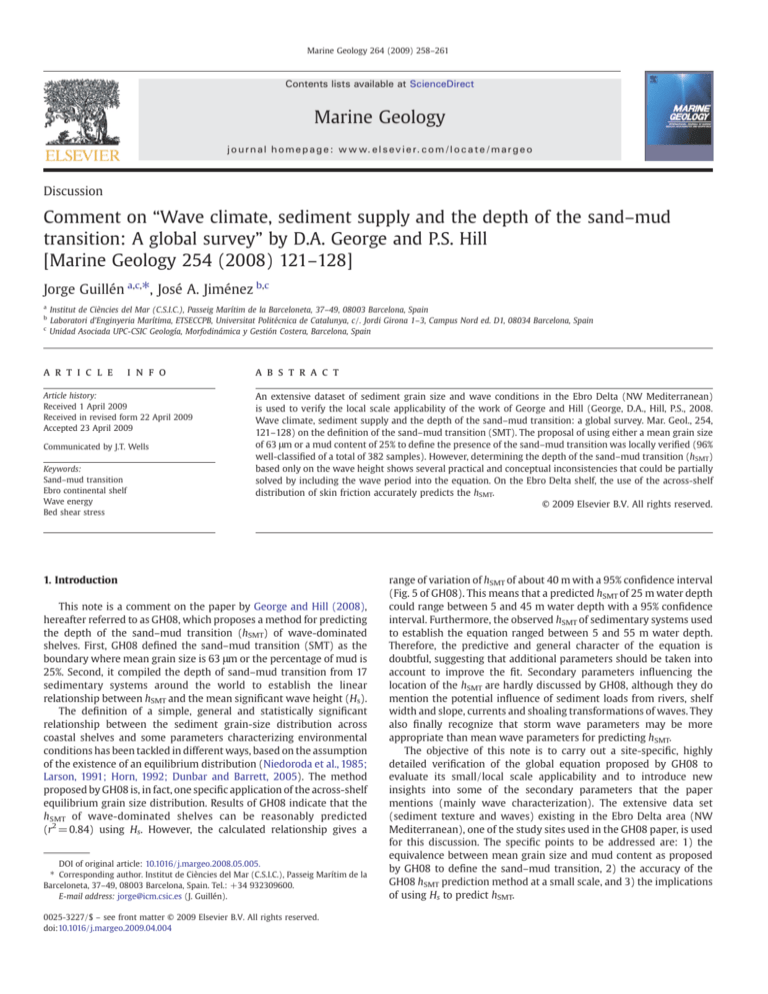
Fig. 2 shows the sediment mean grain size versus the corresponding mud content for all available samples on the Ebro Delta shelf (382
samples). As expected, the increase in mud content is accompanied by
a progressive decrease in mean grain size, which can be fitted to a
logarithmic function with a coefficient of determination, r2, of 0.88.
According to these data, the criteria proposed by GH08 to define the
existence of an SMT from sediment textural parameters (based on
both mean grain size and mud content) are simultaneously fulfilled
by most of the samples. Only 15 samples (4%) indicate different
conditions. From these results, we can conclude that GH08's decision
to use the mean grain size or the mud percentage equally to define the
SMT is very accurate for shelf sediments in a deltaic environment such
as the Ebro Delta.
In order to apply GH08's proposal for defining hSMT from sediment
grain size data, Fig. 3 shows the across-shelf distribution of the two
required parameters (mean grain size and mud content) of surface
sediment samples in the Ebro Delta. The application of the GH08
criteria (d50 b 63 μm, % mud N 25%) to these curves results in a depth
of 11.85 and 12.22 m, respectively. The two parameters provide
Fig. 2. Mean grain size versus mud content for sediment samples on the Ebro Delta
shelf. Dashed lines show the sand–mud transition (SMT) boundary using both sedimentological criteria.
equivalent depths for the Ebro Delta (~ 12 m), which are much
shallower than the ones reported in the area by GH08 (30 m, Table 2
of GH08).
3. Depth of sand–mud transition and waves
Fig. 1. Location of surface sediment samples on the Ebro Delta shelf (Spain, NW
Mediterranean).
Once the hSMT definition from sediment data proposed by GH08
has been applied to the Ebro Delta, the remaining part to be validated
is its prediction by using wave data. GH08 propose a predictive
relationship for hSMT (=(18.5 ± 10.8) Hs + (5.2 ± 17:2)) where the
significant wave height, Hs, is the only variable characterizing the
wave climate. The application of the GH08 relationship to Ebro Delta
wave conditions results in an hSMT value of 20 m, which is 50%
shallower than the measured value reported by GH08 (30 m) and 67%
deeper than that obtained from our intensive sediment grain size data
set (12 m). It must be stressed that although both measured hSMT
values lie between intervals associated with GH08's predictive
formula, these intervals should not be accepted. The reason is that,
according to GH08, predicted hSMT is 20 m but could vary between 0
(in fact it strictly predicts a negative value) and 45.8 m, which would
imply that for such a huge range no predictive relationship should be
needed.
We believe that this wide range in the prediction may lead to
inconsistent results and could even question the validity of a global
relationship for predicting hSMT by using the mean Hs. First, the
assumed correlation between wave height and period introduced by
GH08 is not necessarily true in all the cases, but will depend on the
scale of the analysis. As an example, Fig. 4 shows simultaneous Tp and
Hs values for waves recorded off the Ebro Delta during the period 1990
to 2004, clearly showing the absence of such a Tp–Hs correlation. More
importantly, even if Hs and Tp are well correlated, as GH08 states, the
simple use of Hs for a global predictive formula implies that the Tp–Hs
relationship will be the same regardless of the site where the
transition is to be calculated. According to this, a given Hs value in
the Mediterranean (e.g. the Po or Ebro Deltas) should have the same
associated period as in the Pacific (e.g. Eel) and, in consequence, the
application of GH08's relationship will predict the same hSMT for a
given Hs for both short- and long-period wave environments.
However, for a given Hs the longer the wave period, the larger the
260
J. Guillén, J.A. Jiménez / Marine Geology 264 (2009) 258–261
Fig. 3. Across-shelf distribution of mean grain size and mud content of existing surface sediment samples in the Ebro Delta. The depth of the sand–mud transition is estimated after a
third order polynomial fit of data.
bottom shear stress will be and, in consequence, the deeper the
mobility of the sediment.
To try to overcome these difficulties we used the bottom shear
stress that incorporates height and wave period. Fig. 5 shows the
calculated across-shelf distribution of the skin shear wave stress (τ′b)
for yearly-mean wave conditions in the Ebro Delta measured during
the period 1990–2004 (Hs = 0.85 m, Tp = 5.3 s). This τ′b value was
computed for a grain size of 63 μm and, since sediment data used for
defining hSMT were obtained at different locations along the Ebro
shelf (Fig. 1), we simply considered shoaling as the process affecting
wave conditions during propagation. Therefore, the depth of the
sand–mud transition of the sediment corresponds to the across-shelf
location where the threshold conditions for initiation of movement
hold according to Shields (Dunbar and Barrett, 2005). This condition
was calculated by using the analytical expression of Soulsby and
Whitehouse (1997) as τcr of 0.106 N/m2 for a sediment grain size of
63 μm, and results in a depth of about 12 m, which coincides with the
average hSMT measured along the Ebro shelf from sediment samples.
It should be pointed out that the mean frequency of exceedance
of threshold conditions at the estimated transition depth on the
Ebro Delta shelf during the period 1990–2004 is about 23% and this
frequency rapidly decreases as depth increases (Fig. 5). This serves
to verify the use of the across-shelf distribution of skin friction to
define hSMT.
Finally, in order to check the use of a parameter that is as simple
as possible (simpler than the τ′b N τcr criterion) and to overcome
the above-mentioned inconsistency of GH08 due to the single use of
Hs, we analyzed the dependence of hSMT on the product of Hs ⁎ Tp
(Fig. 6). This parameter mimics some of the basic physics behind the
processes, so at a given depth the longer the wave period, the smaller
the wave height to produce the same bottom stress. Using all the
hSMT values (their Table 2) and wave conditions (their Table 1)
reported by GH08 (but for the Ebro site, from where we use the
values reported here), an r2 of 0.77 is obtained, which increases up
to r2 = 0.92 if the Nepean site is excluded as in GH08. Although
the r2 values obtained are of a similar order of magnitude to the ones
reported by GH08, this parameter should be more robust when
applied to environments with significantly different fetches, and
therefore wave periods.
4. Conclusions
Fig. 4. Relationship between simultaneously measured Tp and Hs in the Ebro Delta
during the period 1990 to 2007.
The global relationship between depth of SMT and mean wave
climate proposed by GH08 has been checked against an extensive,
local, sediment grain size and wave data set from the Ebro Delta
coast to verify its small-scale applicability. The reliability of the criteria proposed for the definition of SMT by using mean grain size
or mud content equally has been verified. There are significant
differences between the hSMT reported in GH08 and our observations. This could be related to the large spatial and temporal
variability of the sediment grain size in deltaic environments.
Extensive sediment sampling covering the entire coast would be
required to reduce such variability and to obtain representative
parameters of the sediment.
J. Guillén, J.A. Jiménez / Marine Geology 264 (2009) 258–261
261
Fig. 5. Across-shelf distributions of near bottom wave-induced skin friction, τ′b, for yearly averaged wave conditions in the Ebro Delta and (ii) frequency of exceedance of threshold
conditions during the period 1990–2004.
The use of the long-term across-shelf distribution of skin friction
to estimate the across-shelf location where critical conditions for
63 μm sediment are exceeded results in an accurate prediction of the
hSMT position in the Ebro Delta. The use of the mean significant wave
height as the only wave parameter to predict hSMT could produce
serious inconsistencies that can be partially solved by including the
wave period. If the wave period is introduced in the relation as a
single parameter, Hs ⁎ Tp, the predictive character of the equation
improves and inconsistencies are removed. Nevertheless, because of
the easy application of the above-mentioned criterion (τ′b N τcr), we
would recommend skipping any further simplification.
Fig. 6. Measured hSMT versus a parameter accounting for wave height and period effects
for all GH08 data (solid line: all data. Dashed line: without Nepean site).
Acknowledgements
The authors would like to thank the Ministry of Territorial Policy
and Public Works (DPTOP) of the Government of Catalonia for
supplying the wave data used in this study. The second author was
supported by a University Research Promotion Award for Young
Researchers from the Government of Catalonia.
References
Díaz, J., Palanques, A., Nelson, C.H., Guillén, J., 1996. Morpho-structure and sedimentology of the Holocene Ebro prodelta mud belt (northwestern Mediterranean Sea).
Cont. Shelf Res. 16, 435–456.
Dunbar, G.B., Barrett, P.J., 2005. Estimating palaeobathymetry of wave-graded
continental shelves from sediment texture. Sedimentology 52, 253–269.
George, D.A., Hill, P.S., 2008. Wave climate, sediment supply and the depth of the sand–
mud transition: a global survey. Mar. Geol. 254, 121–128.
Horn, D.P., 1992. A review an experimental assessment of equilibrium grain size and the
ideal wave-graded profile. Mar. Geol. 108, 161–174.
Guillén, J., Palanques, A., 1997. A shoreface zonation in the Ebro Delta based on grain size
distribution. J. Coast. Res. 13, 867–878.
Larson, M., 1991. Equilibrium profile of a beach with varying grain size. Coastal
Sediments '91. ASCE 905–919.
Niedoroda, A.W., Swift, D.J.P., Hopkins, T.S., 1985. The shoreface. In: Davis, R.A. (Ed.),
Coastal Sedimentary Environments. InSpringer-Verlag, New York, pp. 533–624.
Soulsby, R., Whitehouse, R., 1997. Threshold of sediment motion in coastal environment.
Proc. Pacific Coasts and Ports '97 Conference, University of Canterbury, pp. 149–154.


