Heat Exchangers
advertisement
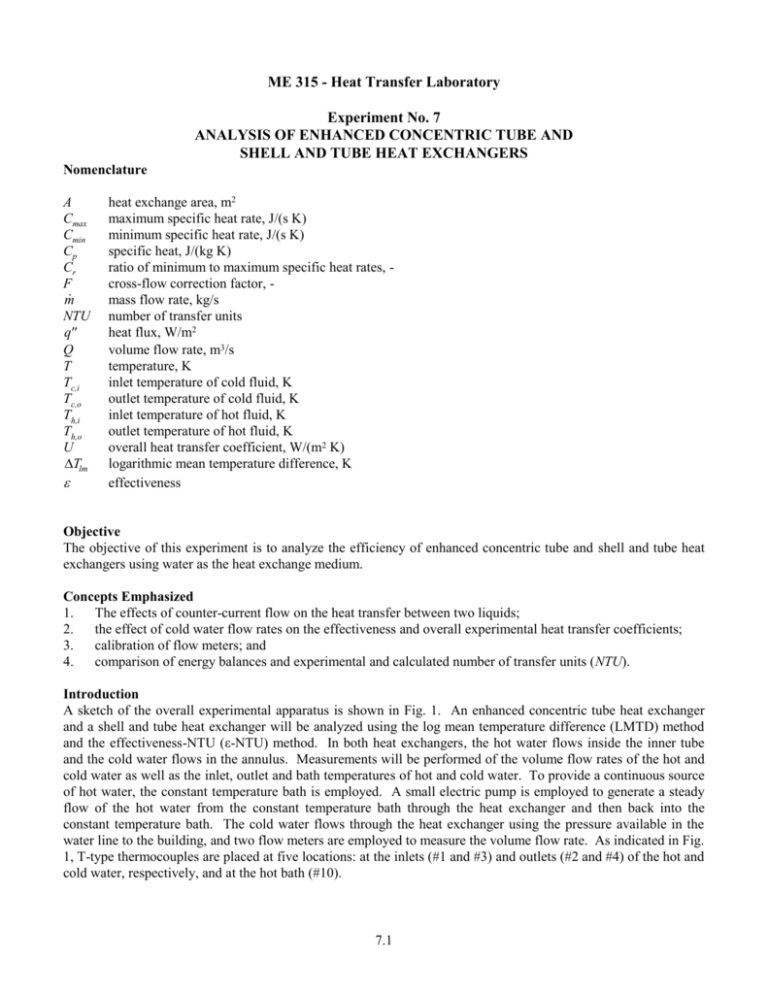
ME 315 - Heat Transfer Laboratory Experiment No. 7 ANALYSIS OF ENHANCED CONCENTRIC TUBE AND SHELL AND TUBE HEAT EXCHANGERS Nomenclature A Cmax Cmin Cp Cr F m NTU q Q T Tc,i Tc,o Th,i Th,o U Tlm heat exchange area, m2 maximum specific heat rate, J/(s K) minimum specific heat rate, J/(s K) specific heat, J/(kg K) ratio of minimum to maximum specific heat rates, cross-flow correction factor, mass flow rate, kg/s number of transfer units heat flux, W/m2 volume flow rate, m3/s temperature, K inlet temperature of cold fluid, K outlet temperature of cold fluid, K inlet temperature of hot fluid, K outlet temperature of hot fluid, K overall heat transfer coefficient, W/(m2 K) logarithmic mean temperature difference, K effectiveness Objective The objective of this experiment is to analyze the efficiency of enhanced concentric tube and shell and tube heat exchangers using water as the heat exchange medium. Concepts Emphasized 1. The effects of counter-current flow on the heat transfer between two liquids; 2. the effect of cold water flow rates on the effectiveness and overall experimental heat transfer coefficients; 3. calibration of flow meters; and 4. comparison of energy balances and experimental and calculated number of transfer units (NTU). Introduction A sketch of the overall experimental apparatus is shown in Fig. 1. An enhanced concentric tube heat exchanger and a shell and tube heat exchanger will be analyzed using the log mean temperature difference (LMTD) method and the effectiveness-NTU (ε-NTU) method. In both heat exchangers, the hot water flows inside the inner tube and the cold water flows in the annulus. Measurements will be performed of the volume flow rates of the hot and cold water as well as the inlet, outlet and bath temperatures of hot and cold water. To provide a continuous source of hot water, the constant temperature bath is employed. A small electric pump is employed to generate a steady flow of the hot water from the constant temperature bath through the heat exchanger and then back into the constant temperature bath. The cold water flows through the heat exchanger using the pressure available in the water line to the building, and two flow meters are employed to measure the volume flow rate. As indicated in Fig. 1, T-type thermocouples are placed at five locations: at the inlets (#1 and #3) and outlets (#2 and #4) of the hot and cold water, respectively, and at the hot bath (#10). 7.1 Figure 1. Schematic diagram of overall heat exchange apparatus. Pre-Lab Calculations To prepare for the experiment the student should complete the following items: 1. Review sections 11.1 through 11.4 of the text by Incropera and DeWitt. 2. To prepare for the analysis of the experimental data, consider a concentric heat exchanger in which the hot and cold fluids flow counter-currently. List the assumptions that you need in order to perform an analysis of the heat exchange effectiveness: (a) (b) (c) (d) (e) 7.2 3. Sketch the temperature development (temperature vs. position) of the hot and cold fluids for a counter-flow heat exchanger: 4. Write expressions for the heat transferred from the hot fluid, and to the cold fluid in terms of the mass flow rates and temperatures entering and exiting: qh = qc = (1) (2) Then the overall heat transfer rate can be written as: q = UAΔTm (3) where ΔTm is an appropriate mean temperature difference and U is the overall heat transfer coefficient, which for the simple shell and tube heat exchanger in this experiment can be expressed as a sum of thermal circuits (Eq. 11.5 in the text): ln ro / ri 1 1 1 UA hi Ai 2kL ho Ao (4) Write the expression for the appropriate mean temperature difference for this heat exchanger, and for the temperature differences ΔT1 & ΔT2: ΔTm = (5a) ΔT1 = ΔT2 = (5b) (5c) The use of the above equations constitutes the LMTD approach for a counter-flow heat exchanger. What is the log mean temperature difference, Tlm , if T2 T1 ? Note: the answer does exist. 7.3 5. The NTU approach is considered next. By following the development in Sect. 11.4.2 of the text for the Effectiveness-NTU method of analysis of a counterflow heat exchanger, it is possible to show that the expression for the effectiveness according to the definition of the NTU is given by 1 exp[ NTU (1 Cr )] 1 Cr exp[ NTU (1 Cr )] 1 1 C where Cr min . NTU ln Cr 1 Cr 1 Cmax or (6a) (6b) What happens to the relationship between NTU and effectiveness (Eq. 6) if Cr 1? 6. The fundamental definition of NTU (Eq. 11.25 in the text) is: NTU UA Cmin (7a) By substituting the definition of heat transfer from (3), we can also write: q Tlm UA NTU Cmin Cmin (7b) q NTU Cmin Tlm (7c) Or: What does NTU stand for? What is the fundamental quantity of heat transfer for a heat exchanger? (Hint: look at equation (7c). What is a “transfer unit”?) 7. h 0. 022kg/s, Th,i=68C, The following data resulted from measurements on a counterflow exchanger: m Th,o=32C, mc 0. 0198kg/s, Tc,i=17C, and Tc,o=52C. Both hot and cold fluids are liquid water. Compute the average heat transferred q ( qh qc ) / 2 , effectiveness q / qmax , and Cr. Calculate NTU using the NTU method and the LMTD approach (i.e., eqs. (6b) and (7b)). 8. Compare the calculated NTU values obtained from Eq. (6b) and Eq. (7b). What do you think to be the cause for the discrepancy between these values? 9. Why would one choose to use the LMTD method over the NTU-Effectiveness method, or vice-versa? 7.4 Pre-Lab Section: The Enhanced Concentric Tube Heat Exchanger One part of this experiment involves measurements using the enhanced concentric tube heat exchanger in which the fluids flow in a counter-current fashion. This heat exchanger uses a spiraling inner copper tube, depicted in Fig. 2, to which is attached a set of annular fins (similar to Fig. 3.14c in the heat transfer text by Incropera and DeWitt). Enhanced Tube Heat Exchanger Hot Out Th,o Cold Water In Tc,i 76mm Spiralling Tube with Fins on the Outer Surface 762mm Cold Water Out Tc,o 25mm ID Tube Hot In Th,i Figure 2. Schematic diagram of enhanced concentric tube heat exchanger. 7.5 Pre-Lab Section: The Shell and Tube Heat Exchanger Another part of this experiment involves measurements using a commercially available shell and tube heat exchanger. The approximate dimensions as well as positions of inlets and outlets are shown in Fig. 3 along with a generic diagram of a shell and tube heat exchanger. A demonstration unit can be found at the lab station. If you closely examine this unit, you will see that the heat exchanger consists of a bank of tubes containing the hot water surrounded by a shell containing the cold water. The heat exchanger is a part of the overall experimental apparatus, which is shown in Fig. 1. The same sources of hot and cold water and flow meters are employed as for the concentric tube heat exchanger. The previously mentioned thermocouples are employed to measure the fluid temperatures. Figure 3. Schematic diagram of the shell and tube heat exchanger and an internal diagram of a similar heat exchanger (Incropera & Dewitt). 7.6 Experimental Procedure Calibrating the flow meters. 1. Your instructor will give a brief discussion of the experimental procedure, which first involves a calibration of the flowmeters and then the measurements of heat exchanger characteristics. From a safety point of view, you should exercise care when working around the heat exchange apparatus. The hot water leaving the constant temperature bath could be about 80C or higher; touching the copper tubes painted red could cause unpleasant burns. 2. The first phase of the experiment involves a calibration of the flow meters. This type of flowmeter, known as a rotameter, must be calibrated for any particular set of fluid conditions. The scale on the meter has undefined units. By measuring the flow rate at various settings, a calibration curve will be attained. Two flow meters are employed. Since this measurement involves hot fluids, you should use the gloves that are available when handling the beaker containing the hot water. 3. Obtain a large graduated cylinder and a large size plastic basin from the instructor. The plastic basin represents our temporary drain. The water outlets are connected to shorter hoses so that we easily can measure the flow rates using a graduate. The flow is directed through these tubes by valves. Also make sure that no electrical cables contact any water on the floor. Before starting the measurements involving the hot water flow meter, please have the instructor check your connections. 4. Measure the flow rate using the float position settings indicated in Table 1. First calibrate the hot water flow meter at a scale reading of 20; and then calibrate the cold water flow meter at scale readings of 5, 10, 15 and 20. Make sure the graduate is dry each time, measure the elapsed time with a stop watch, and measure the volume captured during the elapsed time as accurately as you can. Once the measurements have been performed for the hot water flow meter, turn off the pump and switch the valve so that the hot water will be recirculated into the constant temperature bath. Once again have your instructor come by and check the experimental setup prior to commencing the calibration of the cold water flow meter. 5. Repeat the flow rate measurements for the four cold water settings. Do you think that there is an effect of water temperature on the calibration of the flow meter? If so, please explain. Are there any bubbles in the water that may affect the travel of the carboloy sphere inside the flow meter? Is the relationship between the float travel and flow rates linear? Measurements Using the Shell and Tube Heat Exchanger 1. The next phase involves measurements of inlet, and outlet temperatures of the hot and cold water, respectively, for various flow rates of the hot and cold water. It is clear that numerous measurement situations are possible, and to maximize your experimental experience on the shell and tube heat exchanger, complete the measurements as outlined in Table 2. As indicated in this table, we keep the inlet temperatures of the cold and hot water fixed while changing the volumetric flow rates. 2. Once you have specified the flow directions and adjusted the flow rates to the values indicated in these tables, you must let the system approach steady state. To check if steady state has been achieved, observe the outlet temperatures of the hot and cold water on the digital thermometer. On the digital thermometer, channels 1-2 correspond to temperatures Th,i, and Th,o, respectively, and channels 3-4 correspond to temperatures Tc,i, and Tc,o, respectively, and channel 10 indicates the hot bath temperature. If these temperatures do not change more than 1C over a 5-minute time interval, then we may assume that steady-state conditions have been achieved. Typically, steady state should be reached within 15 minutes or less. 3. Complete Table 2 for this heat exchanger. 7.7 Table 1. Measurement of flow rates. Hot Water Run 1 Run Meter Starting Float Volume Position (ml) Elapsed Time (sec) Volume Rate (cc/sec) Mass Flow Rate (kg/s) 20 Cold Water (with Hot Water Circulating) Meter Starting Ending Elapsed Volume Float Volume Volume Time (sec) Rate Position (ml) (ml) (cc/sec) 1 5 2 10 3 15 4 20 Run Ending Volume (ml) Cold Water (Hot Water Not Circulating) Meter Starting Ending Elapsed Volume Float Volume Volume Time (sec) Rate Position (ml) (ml) (cc/sec) 1 5 2 10 3 15 4 20 7.8 Mass Flow Rate (kg/s) Mass Flow Rate (kg/s) Table 2. Temperature measurements – SHELL AND TUBE HEAT EXCHANGER Hot Water Th, in (C) Run Meter Float Position 1 20 5 2 20 10 3 20 15 4 20 20 Th, out (C) Meter Float Position Cold Water Tc, in (C) Tc, out (C) Measurements Using the Enhanced Concentric Tube Heat Exchanger 1. Switch the flow configuration so that the heat exchange takes place within the enhanced concentric tube heat exchanger. If you need assistance, consult your instructor. 2. Complete Table 3 for the enhanced concentric tube heat exchanger. Table 3. Temperature measurements –CONCENTRIC TUBE HEAT EXCHANGER Hot Water Th, in (C) Run Meter Float Position 1 20 5 2 20 10 3 20 15 4 20 20 Th, out (C) 7.9 Meter Float Position Cold Water Tc, in (C) Tc, out (C) Analysis of Experimental Data 1. Convert the float positions to mass flow rates and record the results in Table 1. 2. Complete Tables 4 and 5 using the data and the equations indicated in the respective table. 3. In this lab, the LMTD method yields the experimental value -- NTU is calculated independent of ε -- and the εNTU method yields the theoretical value -- defining what NTU should be based on geometry and ε. How do you rate the comparison between the measured and the calculated values? What could be the contributing factors to the accuracy or the inaccuracy of the values? 4. For each heat exchanger, plot the ε-NTU theoretical curve (Eq. 6a) using each experimental value of Cr, (see Figs. 11.14 – 11.19 for examples). This will give you 4 curves for each heat exchanger, one for each data point. Add the experimental NTU data to this plot (one point for each curve). Compare the theoretical curve to the experimental data. How accurate is the ε-NTU method for each heat exchanger? Does either heat exchanger show better accuracy? Why or why not? 5. Calculate the predicted uncertainty of effectiveness, ε, and NTU in Tables 4 and 5. Discuss the meaning of the uncertainty and the effect this result has on the apparent accuracy of the experiment. 6. Complete your report, making comments on: a. b. c. d. e. f. g. h. i. calibration of flow meters; effect of cold water flow rate on the rate of energy transfer from hot to cold water effect of type of heat exchanger on the rate of energy transfer from hot to cold water; the meaning and definition of NTU comparison between measured and available (calculated or values obtained in Fig. 11.15 of the heat transfer text) values of the effectiveness and NTU; amount of heat losses to the surroundings; steady-state conditions; uncertainty results; and the overall educational experience with the two tube heat exchangers and areas for possible improvement in the experiment as well as in the manual. 7.10 Table 4. Experimental and theoretical results – SHELL AND TUBE HEAT EXCHANGER. Run qh (W) qc (W) ½(qh+qc) (W) ε Cr NTU (LMTD: Eq. 7b) NTU (ε-NTU: Eq. 6b) 1 2 3 4 Table 5. Experimental and theoretical results – CONCENTRIC TUBE HEAT EXCHANGER. Run qh (W) qc (W) ½(qh+qc) (W) ε 1 2 3 4 7.11 Cr NTU (LMTD: Eq. 7b) NTU (ε-NTU: Eq. 6b) M.E. 315 - Heat Transfer Lab Evaluation Form EXPERIMENT #7 -- Analysis of Enhanced Concentric Tube and Shell and Tube Heat Exchangers This form is to be filled out by each student at the end of each lab experiment, and turned in with the lab report. The purpose is to help the instructor(s) make changes or modifications for the future. Your comments will in no way affect your grade--please be honest in your evaluation. 1. Approximately how much time did you spend on this experiment? ________hours in-class time, 2. 3. ________hours outside of class time What was your overall impression of the experiment? (You can elaborate on any of these in 3. below.) (a) Terrible! I hated it! Why? (b) Didn't like it much, needs these improvements: (c) Satisfactory-some minor changes needed: (d) I enjoyed it and learned a lot. Comments? (e) Fantastic! I loved it! Why? Please give any other specific comments below, which will help us improve the experiment for next semester. 7.12
