THE TWO-PERCENT DILEMMA — AN ASSET ALLOCATION PRIMER REVISITED
WHAT IF …
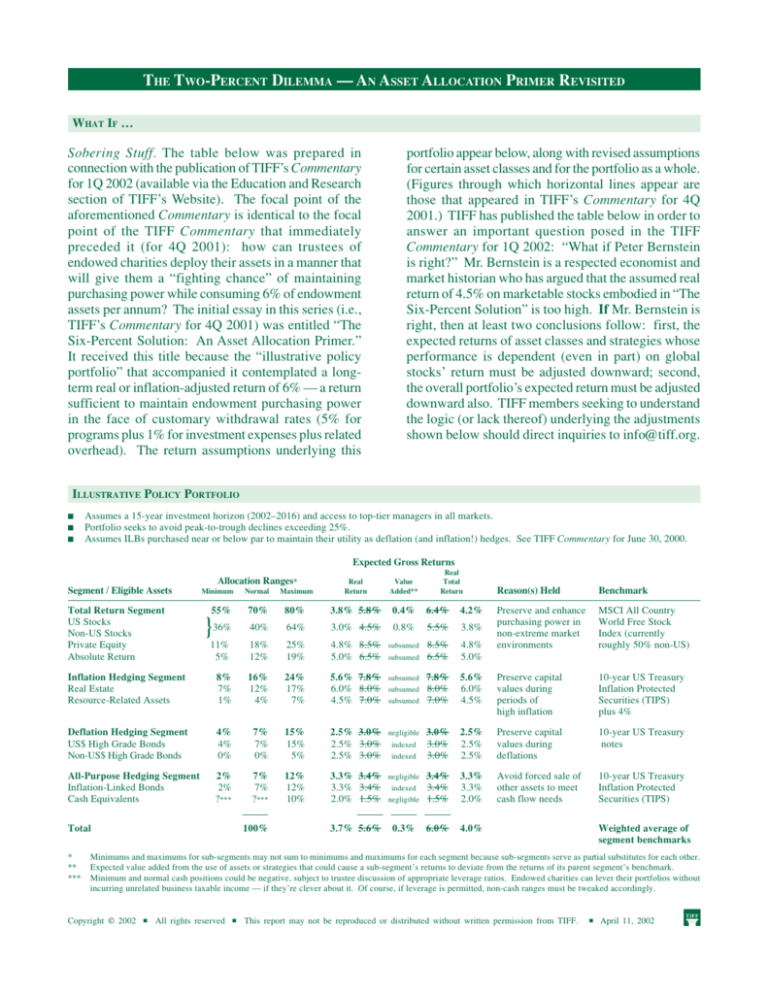
Sobering Stuff. The table below was prepared in
connection with the publication of TIFF’s Commentary
for 1Q 2002 (available via the Education and Research
section of TIFF’s Website). The focal point of the
aforementioned Commentary is identical to the focal
point of the TIFF Commentary that immediately
preceded it (for 4Q 2001): how can trustees of
endowed charities deploy their assets in a manner that
will give them a “fighting chance” of maintaining
purchasing power while consuming 6% of endowment
assets per annum? The initial essay in this series (i.e.,
TIFF’s Commentary for 4Q 2001) was entitled “The
Six-Percent Solution: An Asset Allocation Primer.”
It received this title because the “illustrative policy
portfolio” that accompanied it contemplated a longterm real or inflation-adjusted return of 6% — a return
sufficient to maintain endowment purchasing power
in the face of customary withdrawal rates (5% for
programs plus 1% for investment expenses plus related
overhead). The return assumptions underlying this
portfolio appear below, along with revised assumptions
for certain asset classes and for the portfolio as a whole.
(Figures through which horizontal lines appear are
those that appeared in TIFF’s Commentary for 4Q
2001.) TIFF has published the table below in order to
answer an important question posed in the TIFF
Commentary for 1Q 2002: “What if Peter Bernstein
is right?” Mr. Bernstein is a respected economist and
market historian who has argued that the assumed real
return of 4.5% on marketable stocks embodied in “The
Six-Percent Solution” is too high. If Mr. Bernstein is
right, then at least two conclusions follow: first, the
expected returns of asset classes and strategies whose
performance is dependent (even in part) on global
stocks’ return must be adjusted downward; second,
the overall portfolio’s expected return must be adjusted
downward also. TIFF members seeking to understand
the logic (or lack thereof) underlying the adjustments
shown below should direct inquiries to info@tiff.org.
ILLUSTRATIVE POLICY PORTFOLIO
■
■
■
Assumes a 15-year investment horizon (2002–2016) and access to top-tier managers in all markets.
Portfolio seeks to avoid peak-to-trough declines exceeding 25%.
Assumes ILBs purchased near or below par to maintain their utility as deflation (and inflation!) hedges. See TIFF Commentary for June 30, 2000.
Expected Gross Returns
Allocation Ranges*
Minimum
Normal
Maximum
55%
70%
80%
3.8% 5.8%
0.4%
6.4%
4.2%
36%
40%
64%
3.0% 4.5%
0.8%
5.5%
3.8%
11%
5%
18%
12%
25%
19%
4.8% 8.5%
5.0% 6.5%
subsumed
8.5%
6.5%
4.8%
5.0%
Inflation Hedging Segment
Real Estate
Resource-Related Assets
8%
7%
1%
16%
12%
4%
24%
17%
7%
5.6% 7.8%
6.0% 8.0%
4.5% 7.0%
subsumed
7.8%
8.0%
7.0%
Deflation Hedging Segment
US$ High Grade Bonds
Non-US$ High Grade Bonds
4%
4%
0%
7%
7%
0%
15%
15%
5%
2.5% 3.0%
2.5% 3.0%
2.5% 3.0%
negligible
All-Purpose Hedging Segment
Inflation-Linked Bonds
Cash Equivalents
2%
2%
?***
7%
7%
?***
12%
12%
10%
3.3% 3.4%
3.3% 3.4%
2.0% 1.5%
negligible
3.7% 5.6%
Segment / Eligible Assets
Total Return Segment
US Stocks
Non-US Stocks
Private Equity
Absolute Return
}
Total
*
**
***
100%
Value
Added**
Real
Total
Return
Real
Return
Reason(s) Held
Benchmark
Preserve and enhance
purchasing power in
non-extreme market
environments
MSCI All Country
World Free Stock
Index (currently
roughly 50% non-US)
5.6%
6.0%
4.5%
Preserve capital
values during
periods of
high inflation
10-year US Treasury
Inflation Protected
Securities (TIPS)
plus 4%
3.0%
3.0%
3.0%
2.5%
2.5%
2.5%
Preserve capital
values during
deflations
10-year US Treasury
notes
negligible
3.4%
3.4%
1.5%
3.3%
3.3%
2.0%
Avoid forced sale of
other assets to meet
cash flow needs
10-year US Treasury
Inflation Protected
Securities (TIPS)
0.3%
6.0%
4.0%
subsumed
subsumed
subsumed
indexed
indexed
indexed
Weighted average of
segment benchmarks
Minimums and maximums for sub-segments may not sum to minimums and maximums for each segment because sub-segments serve as partial substitutes for each other.
Expected value added from the use of assets or strategies that could cause a sub-segment’s returns to deviate from the returns of its parent segment’s benchmark.
Minimum and normal cash positions could be negative, subject to trustee discussion of appropriate leverage ratios. Endowed charities can lever their portfolios without
incurring unrelated business taxable income — if they’re clever about it. Of course, if leverage is permitted, non-cash ranges must be tweaked accordingly.
Copyright © 2002
■
All rights reserved
■
This report may not be reproduced or distributed without written permission from TIFF.
■
April 11, 2002


