7 AC Circuits
advertisement

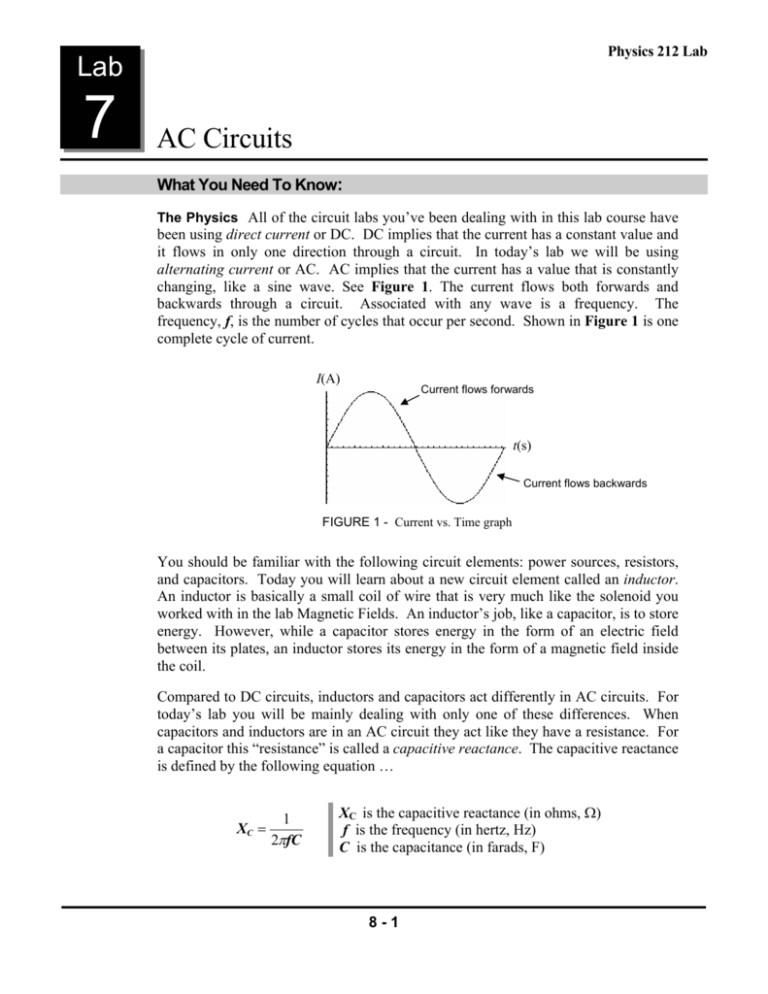
Physics 212 Lab Lab 7 AC Circuits What You Need To Know: The Physics All of the circuit labs you’ve been dealing with in this lab course have been using direct current or DC. DC implies that the current has a constant value and it flows in only one direction through a circuit. In today’s lab we will be using alternating current or AC. AC implies that the current has a value that is constantly changing, like a sine wave. See Figure 1. The current flows both forwards and backwards through a circuit. Associated with any wave is a frequency. The frequency, f, is the number of cycles that occur per second. Shown in Figure 1 is one complete cycle of current. I(A) Current flows forwards t(s) Current flows backwards FIGURE 1 - Current vs. Time graph You should be familiar with the following circuit elements: power sources, resistors, and capacitors. Today you will learn about a new circuit element called an inductor. An inductor is basically a small coil of wire that is very much like the solenoid you worked with in the lab Magnetic Fields. An inductor’s job, like a capacitor, is to store energy. However, while a capacitor stores energy in the form of an electric field between its plates, an inductor stores its energy in the form of a magnetic field inside the coil. Compared to DC circuits, inductors and capacitors act differently in AC circuits. For today’s lab you will be mainly dealing with only one of these differences. When capacitors and inductors are in an AC circuit they act like they have a resistance. For a capacitor this “resistance” is called a capacitive reactance. The capacitive reactance is defined by the following equation … 1 XC = 2πfC XC is the capacitive reactance (in ohms, Ω) f is the frequency (in hertz, Hz) C is the capacitance (in farads, F) 8-1 AC Circuits Physics 212 Lab Since XC acts as a resistance, you can use a form of Ohm’s Law to find the voltage across the capacitor … VC = IXC VC is the voltage across the capacitor (in volts, V) I is the apparent current through the capacitor (in amps, A) XC is the capacitive reactance (in ohms, Ω) An inductor’s resistance in an AC Circuit is called an inductive reactance. The inductive reactance is defined by the following equation … XL = 2πfL XL is the inductive reactance (in ohms, Ω) f is the frequency (in hertz, Hz) L is the inductance (in henrys, H) Since XL acts as a resistance, you can use a form of Ohm’s Law to find the voltage across the inductor … VL = IXL VL is the voltage across the inductor (in volts, V) I is the current through the inductor (in amps, A) XL is the inductive reactance (in ohms, Ω) In DC circuits, you used Kirchhoff’s Loop Law to analyze circuits. This will not work for AC circuits because the current and voltage for capacitors and inductors are out of phase. Instead, you will use the following equation … VS = VR 2 + (VL − VC ) 2 VS VR VL VC is the voltage across the source (in volts, V) is the voltage across the resistor (in volts, V) is the voltage across the inductor (in volts, V) is the voltage across the capacitor (in volts, V) There is one more idea that you need to be introduced to before you begin the lab. At a very specific frequency of current, the capacitive reactance will be equal to the inductive reactance, XC = XL . This frequency is called the resonance frequency. This idea will be discussed more thoroughly while you do the last part of the lab. The main idea of this lab is basically the same as in the Series and Parallel Resistors lab. You are going to use all the above information to analyze an AC Circuit and then compare a calculated final value to the known value. The Equipment You will be using a new piece of equipment for the lab today. It is called a function generator. This will serve as your AC voltage source for your circuit. Your TA will demonstrate how to use this device. What You Need To Do: The Setup The circuit is already hooked up for you. There will be a few little adjustments that you will have to make to the circuit for each part of the lab but they are minor. 8-2 AC Circuits Physics 212 Lab Turn on the function generator. Make sure the 10k button is pressed in the Range area. Also make sure that the “sine wave” button is pressed in the Function area. Next, turn on the voltmeter and set it for ACV in the 2V range. FUNCTION GENERATOR DISPLAY ON RANGE FUNC OUTPUT LEVEL (AMPLITUDE) FREQUENCY Given Value R = 1000 Ω C R FIGURE 2 - Series resistor-capacitor circuit PART 1 - RC Circuit The first circuit you will analyze is a series resistor-capacitor circuit. See Figure 2. The end result of analyzing this circuit is to calculate the value of the capacitor and then compare it to the real value. Make a chart like Chart 1 and do the following … • Using the frequency knobs on the function generator, set the frequency on the function generator to 1000 Hz. You can get a rough number using the COARSE knob and then fine tune the frequency using the FINE knob. • Hook up the leads from the voltmeter so that the voltmeter will read the voltage across the function generator, VS. Adjust the amplitude (OUTPUT LEVEL knob) of the function generator so that you get a reading on the voltmeter that is somewhere between 1.900 V and 1.999 V. Record this in the chart as Voltage Source Measured. • Using the leads from the voltmeter, measure the voltage across the resistor, VR, and measure the voltage across the capacitor, VC. Record both of these values in the chart. • Repeat this procedure for the following frequencies: 1300, 2000, 4000, 5000 Hz. NOTE: Every time you change the frequency you will have to re-adjust the function generator so that the voltage is somewhere between 1.900 V and 1.999 V. In other words, you need to re-check VS with the voltmeter each time you change the frequency. f 1 f VS Measured VS Calculated VR 1000 … CHART 1 8-3 I VC XC C AC Circuits Physics 212 Lab A) Voltage Check It was stated earlier that we couldn’t use the Loop Law because the circuit elements are out of phase. For the 1.0 kHz trial, try to apply the Loop Law to see if it works. Show your work. Now, for each frequency, using the equation given in the introduction of this lab, calculate VS. Show one sample calculation. NOTE: There is no inductor in the circuit so VL = 0. How do these values compare to the measured values? B) Calculations It will be left up to you to calculate the remaining values in the chart. Use the equations from the introduction. HINT: You will also need the VS = VR 2 + (VL − VC )2 given resistor value. First find the current, then XC, and lastly the capacitance. 1 Show one sample calculation for each column. NOTE: Do at least one set of XC = 2πfC calculations to get C for a single row before you move on. This is to ensure that VC = IX C you took your data correctly. EQUATIONS V R = IR C) Comparing Capacitance Calculate the average value of the capacitance. The real value of the capacitor is 2.2 x 10⁻⁸ F. Compare the average value to the real value by calculating a percent error. If your percent error is over 15% then you made an error somewhere. It is up to you to go back to find and correct the error. D) Slope Now you are going to use Graphical Analysis software on the computer desktop to make a graph of XC vs. 1/f . Do not print the graph. On the computer screen you should see two columns labeled X and Y. From your chart, you are going to plug the 1/f values into the X column and the XC values into the Y column. Once you have plotted all of your data push the “R=” button to find the slope. Using this value and the following equation, calculate the capacitance, C. Calculate a percent error with this C value against the average C value you calculated from Chart 1. B= 1 2πC B is the slope value from the computer C is the capacitance E) Question Why is the above equation true? Refer back to the introduction and look at the given equations for hints. FUNCTION GENERATOR Given Value R L R = 1000 Ω FIGURE 3 - Series resistor-inductor circuit PART 2 - RL Circuit This part of the lab is very similar to the last part, except now you have a resistor in series with an inductor. See Figure 3. The end result of analyzing this circuit is to calculate the value of the inductance and then compare it to the given value. Make a chart like Chart 2 on the next page. 8-4 AC Circuits Physics 212 Lab f (kHz) VS Measured VR VL I XL L 2.0 … CHART 2 Now do the following … • Turn off the function generator. On the circuit board, remove the wire from the side socket and place it in the next socket down. This is the RL circuit. EQUATIONS • X L = 2πfL V L = IX L V R = IR IMPORTANT: When measuring the voltage across the inductor, attach the alligator clips only to the tall curly-ended pieces of wire on either side of the inductor. If you do not do this you could damage the inductor. • Follow the same procedure that you did in Part 1 to take the voltage readings. NOTE: Make sure that you re-set the amplitude of the voltage source every time you change the frequency. Use the following frequencies: 2000, 3000, 4000, 5000, 6000 Hz. A) Calculations It will be left up to you to calculate the remaining values in the chart. Use the same method you used in Part 1B. First find the current, then XL, and lastly the inductance. Show one sample calculation for each column. NOTE: Do at least one set of calculations to get L for a single row before you move on. B) Comparing Inductance Calculate the average value of the inductance. The real value of the inductor is 5 x 10⁻² H. Compare the average value to the real value by calculating a percent error. If your percent error is over 15% then you made an error somewhere. It is up to you to go back to find and correct the error. PART 3 - RLC Circuit and Resonance It was stated earlier that resonance occurs in a circuit when XC = XL. This would imply that VC = VL since the current for the capacitor and inductor are the same. If the voltages are equal then the VL – VC part of the VS equation will be zero, or least close to zero. This corresponds to the voltage across both the capacitor and the inductor. You will use this fact to measure the resonance frequency of the circuit. Turn off the function generator. On the circuit board, remove the wire from the side socket and place it in the next socket down so that it corresponds with the circuit in Figure 4. FUNCTION GENERATOR Given Values R R = 1000 Ω L = 5.0 x 10⁻² H C = 2.2 x 10⁻⁸ F C L A B FIGURE 4 - Series resistor-inductor-capacitor circuit 8-5 AC Circuits Physics 212 Lab Set the function generator to 1000 Hz and adjust the amplitude of output, VS, so that 1 V is being supplied to the circuit. Now place the leads from the voltmeter so that they measure the voltage across BOTH the capacitor and the inductor, VLC. See Figure 4 at points A and B. You are going to use Graphical Analysis to make a graph of Voltage (across L-C) vs. Frequency. Keep a record of your data on your paper (in a table) and also enter the data into the computer as you go. Frequency will be X and Voltage will be Y. Start with increments of 1000 Hz. Note: Every time you change the frequency make sure that VS is still 1V before you measure VLC. You will get a relatively straight horizontal line at first but it will soon change drastically. When this happens, change the increments to 300 Hz. Continue taking data until you reach 10,000 Hz. You can use increments of 1000 Hz after the graph levels off again. A) When finished, make a sketch of the graph on your paper. It does not have to be exact, just free-hand sketch it. Label on your graph at what point the circuit is in resonance. Record the resonance frequency. How do you know that the circuit is in resonance? B) Calculate the resonance frequency using the following equation … fR = 1 2π LC fR is the resonance frequency (in hertz, Hz) L is the calculated inductance from Part 2 (in henrys, H) C is the calculated capacitance from Part 1 (in farads, F) Compare the calculated resonance frequency to the one you recorded from the graph by calculating a percent error. What You Need To Turn In: Make sure that all calculations are done in the sections which ask for them. There are no graphs to turn in except for the sketch in Part 3A. © 2008 by Michael J. Dubuque 8-6


