Regression Group Worksheet Key
advertisement

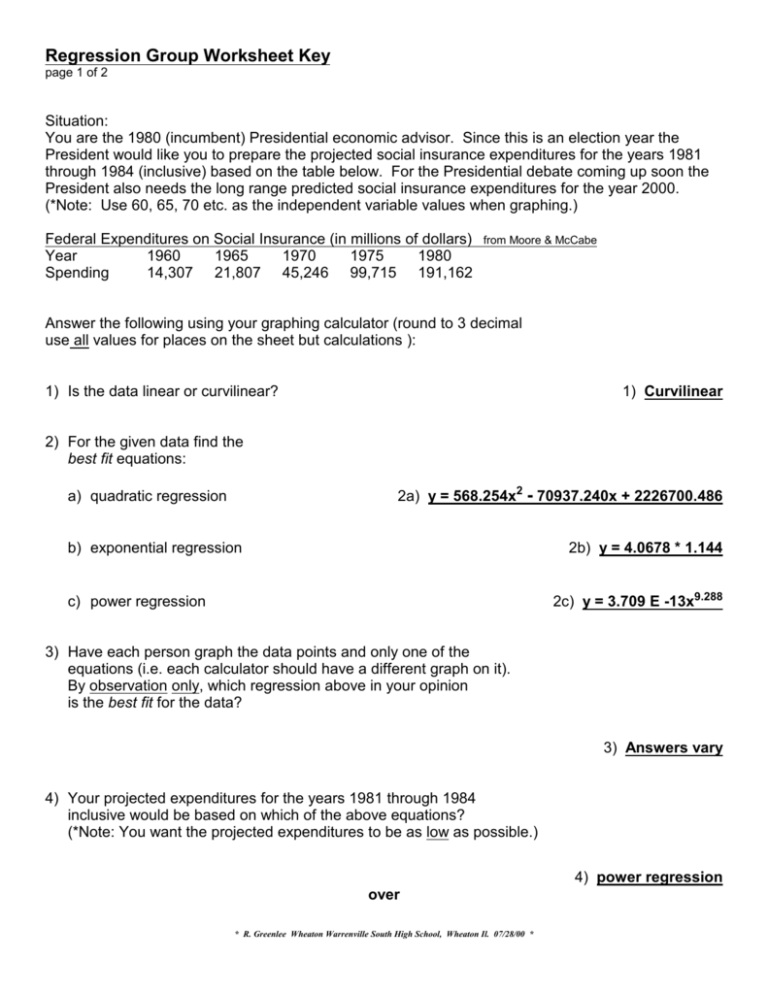
Regression Group Worksheet Key page 1 of 2 Situation: You are the 1980 (incumbent) Presidential economic advisor. Since this is an election year the President would like you to prepare the projected social insurance expenditures for the years 1981 through 1984 (inclusive) based on the table below. For the Presidential debate coming up soon the President also needs the long range predicted social insurance expenditures for the year 2000. (*Note: Use 60, 65, 70 etc. as the independent variable values when graphing.) Federal Expenditures on Social Insurance (in millions of dollars) Year 1960 1965 1970 1975 1980 Spending 14,307 21,807 45,246 99,715 191,162 from Moore & McCabe Answer the following using your graphing calculator (round to 3 decimal use all values for places on the sheet but calculations ): 1) Is the data linear or curvilinear? 1) Curvilinear 2) For the given data find the best fit equations: 2a) y = 568.254x2 - 70937.240x + 2226700.486 a) quadratic regression b) exponential regression 2b) y = 4.0678 * 1.144 2c) y = 3.709 E -13x9.288 c) power regression 3) Have each person graph the data points and only one of the equations (i.e. each calculator should have a different graph on it). By observation only, which regression above in your opinion is the best fit for the data? 3) Answers vary 4) Your projected expenditures for the years 1981 through 1984 inclusive would be based on which of the above equations? (*Note: You want the projected expenditures to be as low as possible.) 4) power regression over * R. Greenlee Wheaton Warrenville South High School, Wheaton Il. 07/28/00 * Regression Group Worksheet Key continued page 2 of 2 5) Graph the data points and equations out to the year 2000 (i.e. x= 100) then TRACE over to 2000 (hint: divide up the work). Note: You could also use the TABLE feature on the calculator (except on TI81's). WINDOW/RANGE Hints: TI81's use X[58 , 105.5], Y[-350000 , 3000000]; for TI82's and TI83's use X[58 , 105], Y[-350000 , 3000000]; for TI85's use X[58 , 120], Y[-350000 , 3000000] a) Your projected expenditures for the year 2000 would 5a) quadratic regression be based on which of the regression equations? (*Note: You want the projected expenditures to be as low as possible.) b) What will be your projected expenditure for the year 2000? 5b) $816,519.34 million 6) For the same set of data, a) do you think it is proper (ethical) to use different equations in different projected situations? (yes or no) 6a) No? b) Explain using complete sentences: Answers Vary____________________________________________________________ ________________________________________________________________________ ________________________________________________________________________ ________________________________________________________________________ 7) Explain, using complete sentences, a situation when the exponential regression projection for the year 2000 would be used. Answers Vary____________________________________________________________ ________________________________________________________________________ ________________________________________________________________________ ________________________________________________________________________ Extra Credit: A) Who was the incumbent President in 1980? B) Who ran against him in 1980 and defeated him? C) The answer to B) was what number president? * R. Greenlee Wheaton Warrenville South High School, Wheaton Il. 07/28/00 * A) Jimmy Carter B) Ronald Reagan C) 40th


