Homework on interpreting and drawing distance time graphs
advertisement
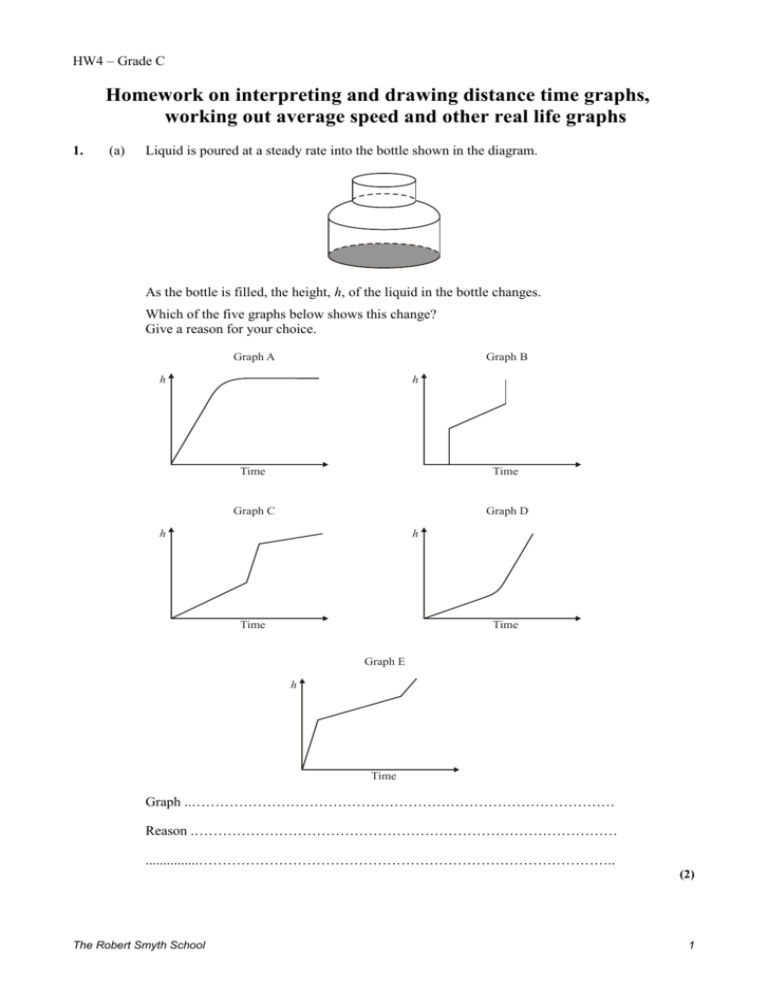
HW4 – Grade C Homework on interpreting and drawing distance time graphs, working out average speed and other real life graphs 1. (a) Liquid is poured at a steady rate into the bottle shown in the diagram. As the bottle is filled, the height, h, of the liquid in the bottle changes. Which of the five graphs below shows this change? Give a reason for your choice. Graph A Graph B h h Time Time Graph C Graph D h h Time Time Graph E h Time Graph ..……………………………………………………………………………… Reason .……………………………………………………………………………… ...............…………………………………………………………………………….. (2) The Robert Smyth School 1 (b) Liquid is poured at a steady rate into another container. The graph shows how the height, h, of the liquid in this container changes. h Time Sketch a picture of this container. (1) (Total 3 marks) 2. Mr Smith leaves the home at 10 am to go to the shopping mall. He walks to the station where he catches a train. He gets off the train at the mall. The travel graph shows his journey. 15 10 Distance from home (km) 5 0 10 am 11 am 12 am 1pm 2 pm Time After shopping Mr Smith goes home by taxi. The taxi leaves the mall at 1 pm and arrives at his home at 1.45 pm. (a) Complete the travel graph. (b) Calculate the average speed of the taxi. (2) ..................................................................................................................................... ..................................................................................................................................... Answer .......................................................km per hour (2) (Total 4 marks) The Robert Smyth School 2 3. The graph shows Amy’s progress on a sponsored walk. 20 15 10 Distance (km) 5 0 1000 (a) 1100 1200 1300 Time of day 1400 1500 How many times does Amy stop during her walk? Answer............................................................................... (1) (b) Between which times does Amy walk the fastest? Explain your answer. Answer ................................................................ Explanation ................................................................................................................. ..................................................................................................................................... (2) (c) Bill sponsors Amy for 20 pence per kilometre. Kate sponsors Amy for 30 pence per kilometre. How much should Amy collect altogether from Bill and Kate after her walk? ..................................................................................................................................... ..................................................................................................................................... ..................................................................................................................................... ..................................................................................................................................... Answer............................................................................... (3) (Total 6 marks) The Robert Smyth School 3 4. Wayne cycles from Newcastle to Ashington, a distance of 20 miles. The diagram shows the distance-time graph of his journey. 20 16 Distance from Newcastle 12 (miles) 8 4 0 10.00 (a) 11.00 12.00 13.00 14.00 Time How far from Newcastle is Wayne at 11.00? Answer .......................................... miles (1) (b) Describe what is happening between 12.00 and 13.00 ..................................................................................................................................... ..................................................................................................................................... (1) (c) How far does Wayne travel in the first 2 hours of his journey? Answer .......................................... miles (1) (d) What is Wayne’s average speed over the first 2 hours of his journey? ..................................................................................................................................... ..................................................................................................................................... Answer ........................................... mph (2) (e) Darren travels from Ashington to Newcastle by bus. He leaves Ashington at 10.00 and arrives in Newcastle at 11.00 On the diagram draw a possible distance-time graph of Darren’s journey. (1) (Total 6 marks) The Robert Smyth School 4 5. Mrs Murphy drives from Pyeton (P) to Queenswell (Q). The graph shows her journey. 50 R 40 Distance in km 30 Q 20 10 P 0 1000 1020 1040 1100 1120 1140 Time (a) How far is it from Pyeton to Queenswell? ..................................................................................................................................... Answer ………………………………….. km (1) (b) At what time does she arrive at Queenswell? ..................................................................................................................................... Answer ……………………………………… (1) (c) Mrs Murphy stays at Queenswell for 20 minutes. Then she drives on to Rokeby (R) at the same speed as before. (i) Show the rest of her journey on the grid. ........................................................................................................................... ........................................................................................................................... (3) (ii) At what time does she arrive at Rokeby? Answer ……………………………………… (1) (Total 6 marks) The Robert Smyth School 5 6. The graph shows a train journey. D E 100 75 Distance from start (km) B 50 C 25 A F 0 0 1 2 3 4 5 Time (hours) (a) What is happening from B to C? ..................................................................................................................................... (1) (b) Which part of the journey is faster, from A to B or from C to D? Explain your answer. ..................................................................................................................................... ..................................................................................................................................... (1) (c) How far did the train travel altogether? ..................................................................................................................................... ..................................................................................................................................... Answer ................................................................ km (2) (Total 4 marks) The Robert Smyth School 6 7. The distance-time graph shows the journey of a train between two stations. The stations are 6 kilometres apart. 6 5 4 Distance (kilometres) 3 2 1 0 0 (a) 1 2 3 4 5 6 Time (minutes) 7 8 9 10 During the journey the train stopped at a signal. For how long was the train stopped? ........................…......................................................................................................... Answer ................................................... minutes (1) (b) What was the average speed of the train for the whole journey? Give your answer in kilometres per hour. ........................…......................................................................................................... ........................…......................................................................................................... Answer .............................. kilometres per hour (2) (Total 3 marks) 8. The graphs show two parts of a train journey. Describe in words what is happening in each part. (a) Speed Time ...................................................................................................................................... ...................................................................................................................................... (1) The Robert Smyth School 7 (b) Speed Time ...................................................................................................................................... ...................................................................................................................................... (2) (Total 3 marks) The Robert Smyth School 8 1. (a) Graph D B1 Slow, steady, faster steady Steady rate and an indication why quicker at top. (b) Any container with uniform vertical cross-section Allow 2-D, e.g. Rectangle, and/or substantially uniform Xsection DB1 B1 [3] 2. (a) Line from (11:15,12) to (13:00,12) ± 1mm ‘Line’ from (13:00,12) to (13:45,0) ft their (13:00,12) ± 1mm (b) ‘Their 12’ ÷ ‘Their 45mins’ oe 12 ÷ 0:45, 1200 ÷ 45 etc Allow ft from the ‘distance’ and ‘time’ on their graph 16 B1 B1ft M1 A1ft ft if Ml awarded rounded 3sf. [4] 3. (a) 2 B1 (b) 1130 and 1230 Steepest (or steeper) line oe, e.g. covers greater distance in same time B1 B1 (c) 19 B1 20 × (their 19) +30 × (their 19) oe M1 9.50 A1ft [6] 4. (a) 8 B1 (b) Not moving B1 Same distance from Newcastle oe (c) 16 B1 (d) Their 16/2 M1 8 (e) A1ft Line or curve from (10.00, 20) to (11.00,0) B1 [6] 5. (a) 27 B1 (b) 1036 B1 (c) (i) Horizontal line to 1056 or line up from 1056 Bl Line leaving Q after 1040 and arriving at R 24 min later Tolerance on 24 min = ± 2 min M1 Correct line from 1056 to 1120 A1 The Robert Smyth School 9 (ii) 1120 Blft ft where their line arrives at R Tolerance ± 1 min [6] 6. (a) Not moving B1 (b) oe A to B and acceptable reason Accept: Steeper B1 Because it only takes 1 hour 2 Longer from C to D Note: ignore incorrect times (further working) if implication is correct (c) 100 × 2 M1 oe 200 A1 [4] 7. (a) 2 B1 (b) 6 km in 10 minutes 6/10 oe M1 36 kph A1 [3] 8. (a) Moving at constant speed Same time and same speed B0 B1 (b) Slowing down B1 (then) speeding up eg Variable speed B1 Down then up B0 Slows down, stops, speeds up B1 B1 [3] The Robert Smyth School 10
