Transformations of Basic Functions
advertisement

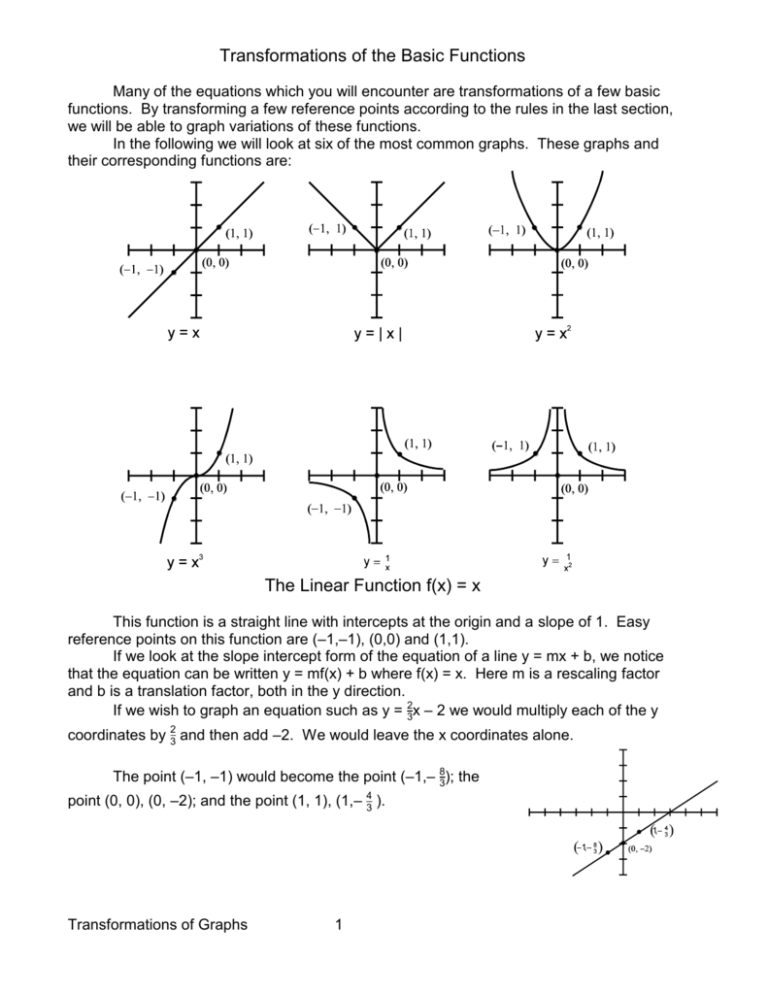
Transformations of the Basic Functions Many of the equations which you will encounter are transformations of a few basic functions. By transforming a few reference points according to the rules in the last section, we will be able to graph variations of these functions. In the following we will look at six of the most common graphs. These graphs and their corresponding functions are: The Linear Function f(x) = x This function is a straight line with intercepts at the origin and a slope of 1. Easy reference points on this function are (–1,–1), (0,0) and (1,1). If we look at the slope intercept form of the equation of a line y = mx + b, we notice that the equation can be written y = mf(x) + b where f(x) = x. Here m is a rescaling factor and b is a translation factor, both in the y direction. If we wish to graph an equation such as y = 23x – 2 we would multiply each of the y coordinates by 23 and then add –2. We would leave the x coordinates alone. The point (–1, –1) would become the point (–1,– 83); the point (0, 0), (0, –2); and the point (1, 1), (1,– 43 ). Transformations of Graphs 1 The Absolute Value Function f(x) = | x | The three reference points that we will use on the absolute value function are (–1, 1), (0, 0), and (1, 1). Let us graph the function y = –2| 32 x – 1| + 4. This equation can be rewritten as y = –2f( 32 x – 1) + 4 where f(x) = | x |. Transformations outside the function symbol affect only the y values. Therefore, we multiply each y coordinate by –2 and add 4. I.e., y' = –2y + 4. On the inside of the function symbol we change only the x values. Let 3 2 x = 2 x' – 1 and solve for x' getting x' = 3 (x + 1). Applying these transformations to the reference points yields: (–1, 1) (0, 2) (0, 0) ( 23, 4) (1, 1) ( 43, 2) The Quadratic Function f(x) = x2 The quadratic will occur again in future sections, once in conics and again under polynomials. Here we will only concern ourselves with transformations of the graph. The three reference points are (–1, 1), (0, 0), and (1, 1). To graph any quadratic we need only look at transformations of these points on the graph of y = x 2. As an example let us graph the equation y = (12 x – 2)2 – 1. Using the function definition f(x) = x2, we can rewrite the equation in function notation as y = f(12 x – 2) – 1. A question that frequently arises is "What happens to the exponent 2?" The function rule f(x) = x2 means "square whatever is inside the function symbol f( )". The exponent is not lost, it is replaced by another way of saying "square." Each of the y coordinates is translated down 1 unit (subtract 1 from each y coordinate according to the transformation equation y' = y – 1). Each x coordinate is shifted 2 units to the right and multiplied by 2. The inside function transformation equation 1 for x is found by setting x = 2 x' – 2. This gives x' = 2( x + 2 ) = 2 x + 4. The three basic points and graph become: (–1, 1) (2, 0) (0, 0) (4, –1) (1, 1) (6, 0) Transformations of Graphs 2 Graph the equation y = x2 + 2 x + 3. Before we can graph this equation we must first write it in a form showing the basic function. To do this we complete the square on the quadratic and use the function f(x) = x2. Completing the square yields y = ( x + 1 )2 + 2 or y = f( x + 1 ) + 2. Because there are no rescaling factors this is simply a translation of the graph 2 units in the positive y direction (add 2 to each of the y coordinates) and 1 unit in the negative x direction (subtract 1 from each x coordinate). The transformation is: (–1, 1) (–2, 0) (0, 0) ( –1, 2) (1, 1) (0, 3) The Cubic Function f(x) = x3 The graph of the cubic has the three reference points (–1, –1), (0, 0), and (1, 1). When graphing a cubic we apply the appropriate transformations to these three points. Graph the equation y = 25 (x – 2)3 – 2. Converting to function notation with f(x) = x3, we get the equation y = 25 f(x – 2) – 2. The transformation in the y direction consists of a rescaling of 25 and a translation of –2 units in the y direction or y' = 25 f(x) – 2. The transformation in the x direction is simply a shift of 2 units in the positive x direction or x' = x + 2. The graph of the function and transformation of points is: (–1, –1) (1, – 12 5 ) (0, 0) (2, –2) (1, 1) (3, – 85 ) Transformations of Graphs 3 1 The Reciprocal Function f(x) = x The reciprocal function has both a vertical and a horizontal asymptote (which are the lines x = 0 and y = 0). The intersection of the asymptotes is the coordinate (0, 0) which is one of the three reference points for the function. The other two reference points are (–1, –1) and (1, 1). When transforming this function the transformation of the point (0, 0) becomes the intersection point of the new asymptotes. The asymptotes will retain their vertical and horizontal directions. 1 Graph the function y = 2x – 1 + 2. 1 Using f(x) = x and rewriting the equation using function notation we get 1 y = f(2x – 1) + 2 (remember, f(x) means x). The transformation in the y direction is a shift of 2 units in the positive direction or y' = y + 2. The transformation in the x direction consists of a 1 unit shift in the positive direction and a rescaling by 12 or x' = 12 ( x + 1 ). The transformation gives: (–1, –1) (0, 1) (0, 0) ( 12, 2) (1, 1) (1, 3) The vertical and horizontal asymptotes are now centered at the point ( 12, 2 ). The rest of the graph is placed around these asymptotes in the same fashion as the old asymptotes. Transformations of Graphs 4 1 The Inverse Square Function f(x) = x2 The reciprocal function of x2 also has horizontal and vertical asymptotes. Unlike the reciprocal function this function is always positive and its graph is above the x axis. The standard reference points are (–1, 1), (0, 0) (again the center of the asymptotes), and (1, 1). 2 1 Graph the equation y = 3 (3x – 2)2 – 4. 1 This can be rewritten in function notation as y = 23 f(3x – 2 ) – 4 where f(x) = x2. The transformation on the y coordinates is y' = 23 y – 4. The transformation on the x coordinates is x' = 13(x + 2 ) found by setting x = 3x' – 2 and solving for x'. Notice that the intersection point of the asymptotes is ( 23, –4 ). (–1, –1) ( 13 , – 10 3 ) (0, 0) ( 23 , –4) (1, 1) (1, – 10 3 ) Functions Inside of Absolute Value Signs Sometimes we need to graph an equation that has a function inside of an absolute value symbol. For example, something like y = |x2 – 4|. In this example we have a quadratic function inside of the absolute value. (Please note - this is not the same as the absolute value function talked about earlier in this section although there is a relationship.) To graph this situation we need to break the graphing process into several distinct parts. First we need to graph the function inside the absolute value symbol. Then apply the absolute value operation to the graph. Lastly, apply any transformations that are outside the absolute value. Remember from your basic algebra that absolute values make everything inside of them positive. If y = f(x), then |y| = |f ( x )|. To make the function values positive we make all the y coordinates positive. If a y coordinate is already positive we leave it alone. If negative we change the sign and replot. Consider the above example y = |x2 – 4|. We start by graphing the inside equation x2 – 4. Transformations of Graphs 5 This graph is negative below the x axis on the interval –2 < x < 2. To apply the absolute value to the graph we take the portion of the graph over this interval and fold it up over the x axis making it positive. When working with functions inside of absolute values be sure to graph the function inside the absolute values signs first. Then apply the absolute value function. If the absolute value is also to be transformed, do this only after you have done everything else. For example, to graph the function y = 2|x3 + 1| – 1 we would first graph the equation x3 + 1. Once we have graphed this function we apply the absolute value to the graph making all points below the x axis positive (reflecting them about the x axis). f(x) = x3 + 1 g(x) = |x3 + 1| y = 2|x3 + 1| 1 If q(x) = |x3 + 1| then we have the graph of q. Now we want to finish the graph. The rest of the graph is a transformation of q, i.e., y = 2q( x ) – 1. To apply the transformation we multiply each of the y coordinates of q by 2 and subtract 1. Transformations of Graphs 6 Problems Rewrite each of the following equations in function notation using the appropriate function. Graph each equation by transforming the graph of the basic function. 1. 2. 3. 4. 5. 6. 7. 8. 9. y = |x + 2| 1 y = (x – 2)2 25. 26. y = (x – 2)2 1 y = (x + 1)2 27. y = –2x2 – 3x + 1 y = –2(x – 1)3 + 1 2 y = (–x + 3)2 + 1 28. 1 y = –x + 1 29. 1 1 y = 2 x2 + 2 30. –1 y=x+1 31. 1 y = –x – 1 y = (x + 1)3 y = 2(x + 1)2 + 3 y = (2x – 2)3 + 3 2 y=x+1 1 y=x+1–1 10. 11. y = 3(x + 1)3 – 2 y = 2|x + 3| – 3 12. 1 1 y = 2 x + 2 + 1 13. 1 y = 2x + 4 + 1 14. 1 1 y = 2 (2x – 1)2 + 1 32. 33. 34. y = –|x + 2| y = 2(x + 2)2 + 2 1 y = 2(x + 2) + 2 37. y = 2(x + 2)3 + 2 y = 2x2 – 3x + 1 x–1 y=x+1 38. x+1 y=x–1 y = –x2 – x + 1 y = –x2 + x + 1 y = x2 – x + 1 y = –2|x – 3| + 1 35. 36. 15. 2 y = (2x – 1)2 + 2 16. 17. 18. y = x2 + 2x + 1 y = 2x2 + 2x + 1 y = 3x2 + 1 39. 40. 41. 42. 19. y = 3(12 x – 2)3 + 2 43. y = 12 (2x2 + 1) – 1 20. y = 3(12 x – 2)2 – 1 44. 21. 3 y = 2x – 5 + 3 45. y = x3 + 3x2 + 3x + 3 3 y = 2(x + 2)2 + 1 22. 1 y = 2(x + 2)2 – 7 46. 2 y = 3x + 1 – 1 23. 1 y = (3x + 6)2 47. 48. 24. y = 12 |2x + 3| – 1 49. Transformations of Graphs 7 y = |x3| + 3 y = |x3 – 1| 1 y = |x + 2| 50. 1 y = |x – 2| + 1 51. 52. 53. 54. y = |x2 – 2| y = |x2 + 2| y = –|2x2 + 3| – 3 y = |x2 – 2| + 3 55. 1 y = x – 2 Transformations of Graphs 56. 57. 58. 59. 60. 8 y = 2|x2 – x – 6| y = ||x2 – 4| – 4| – 4 y = –|x2 – 2| + 2 1 –y x+1= 2 1 2(y + 1) + x = 0 Answers 1. 3. 2. 4. 5. 6. 7. 8. 9. 10. 13. Transformations of Graphs 11. 12. 14. 15. 9 16. 19. 22. 17. 18. 20. 24. 23. 25. 26. 28. 29. Transformations of Graphs 21. 27. 30. 10 31. 34. 37. 40. 44. Transformations of Graphs 32. 33. 35. 36. 38. 39. 42. 41. 59. 54. 11


