Transforming Linear Functions: Algebra Lesson
advertisement
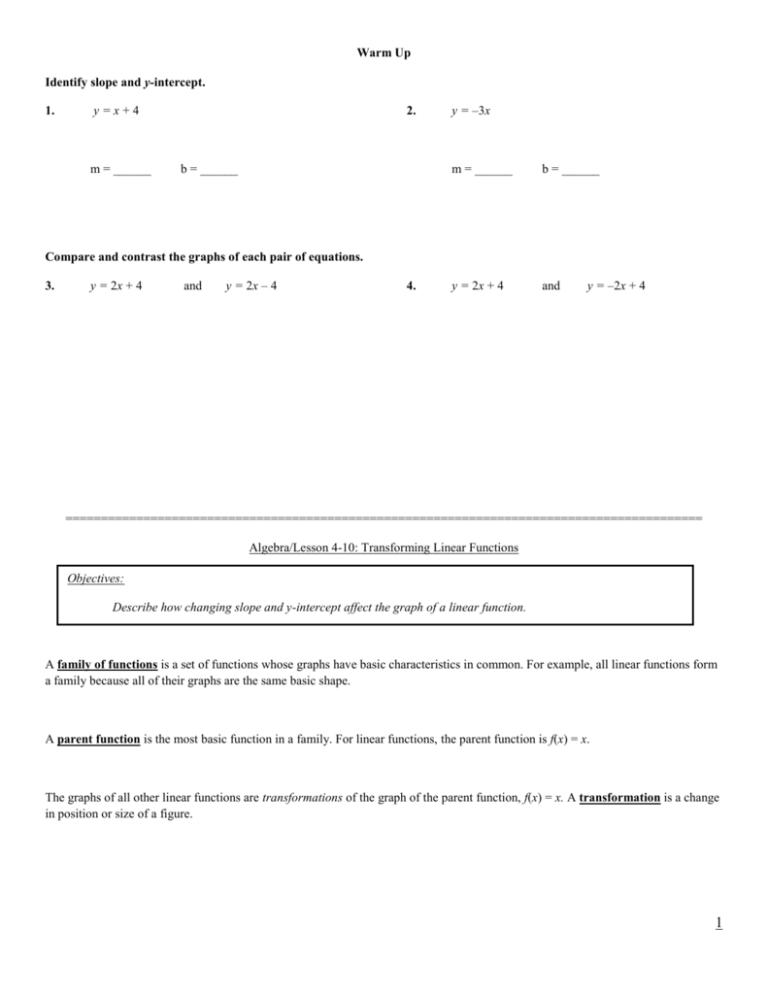
Warm Up Identify slope and y-intercept. 1. y=x+4 m = ______ 2. b = ______ y = –3x m = ______ b = ______ y = 2x + 4 and Compare and contrast the graphs of each pair of equations. 3. y = 2x + 4 and y = 2x – 4 4. y = –2x + 4 ========================================================================================== Algebra/Lesson 4-10: Transforming Linear Functions Objectives: Describe how changing slope and y-intercept affect the graph of a linear function. A family of functions is a set of functions whose graphs have basic characteristics in common. For example, all linear functions form a family because all of their graphs are the same basic shape. A parent function is the most basic function in a family. For linear functions, the parent function is f(x) = x. The graphs of all other linear functions are transformations of the graph of the parent function, f(x) = x. A transformation is a change in position or size of a figure. 1 There are three types of transformations– translations, rotations, and reflections. Look at the four functions and their graphs below. The graphs of g(x) = x + 3, h(x) = x – 2, and k(x) = x – 4, are vertical translations of the graph of the parent function, f(x) = x. A translation is a type of transformation that moves every point the same distance in the same direction. You can think of a translation as a “slide.” Example 1: Translating Linear Functions Graph f(x) = 2x and g(x) = 2x – 6. Then describe the transformation from the graph of f(x) to the graph of g(x). f(x) = 2x g(x) = 2x – 6 The graph of g(x) = 2x – 6 is the result of translating the graph of f(x) = 2x 6 units down. 2 C.I.O.-Example 1: Graph f(x) = x – 2 and g(x) = x + 4. Then describe the transformation from the graph of f(x) to the graph of g(x). 1 The graphs of g(x) = 3x, h(x) = 5x, and k(x) = 𝑥 2 are rotations of the graph f(x) = x. A rotation is a transformation about a point. You can think of a rotation as a “turn.” The y-intercepts are the same, but the slopes are different. Example 2: Graph f(x) = x and g(x) = 5x. Then describe the transformation from the graph of f(x) to the graph of g(x). The graph of g(x) = 5x is the result of rotating the graph of f(x) = x about (0, 0). The graph of g(x) is steeper than the graph of f(x). f(x) = x g(x) = 5x 3 C.I.O.-Example 2: Graph f(x) = 3x – 1 and g(x) = x – 1. Then describe the transformation graph of f(x) to the graph of g(x). from the Example 4(before Ex 3): Multiple Transformations of Linear Functions Graph f(x) = x and g(x) = 2x – 3. Then describe the transformations from the graph of f(x) to the graph of g(x). Find transformations of f(x) = x that will result in g(x) = 2x – 3: The transformations are a rotation and a translation. Example 5 (before Ex 3): A florist charges $25 for a vase plus $4.50 for each flower. The total charge for the vase and flowers is given by the function f(x) = 4.50x + 25. How will the graph change if the vase’s cost is raised to $35? if the charge per flower is lowered to $3.00? f(x) = 4.50x + 25 is graphed in blue. If the vase’s price is raised to $35, the new function is f(g) = 4.50x + 35. The original graph will be translated 10 units up. If the charge per flower is lowered to $3.00, the new function is h(x) = 3.00x + 25. The original graph will be rotated clockwise about (0, 25) and become less steep. 4 C.I.O.-Example 5: A trophy company charges $175 for a trophy plus $0.20 per letter for engraving. The total charge is given f(x) = 0.2x + 175. The graph of this function is shown in blue (top). What if ...? How will the graph be affected if the charge per letter is lowered to $0.15? What if…? How will the graph change if the trophy’s cost is raised to $180? The diagram shows the reflection of the graph of f(x) = 2x across the y-axis, producing the graph of g(x) = –2x. A reflection is a transformation across a line that produces a mirror image. You can think of a reflection as a “flip” over a line. Example 3(after Ex 4 & 5): Graph f(x) = 2x + 2. Then reflect the graph of f(x) across the y-axis. Write a function g(x) to describe the new graph. g(x) f(x) 5 C.I.O.-Example 3: Graph (𝑥) = 2 3 𝑥 + 2 . Then reflect the graph of f(x) across the y-axis. Write a function g(x) to describe the new graph. C.I.O.-Example 4: Graph f(x) = x and g(x) = –x + 2. Then describe the transformations from the graph of f(x) to the graph of g(x). Lesson Quiz: Part I Describe the transformation from the graph of f(x) to the graph of g(x). 1. f(x) = 4x, g(x) = x 3. f(x) = 𝑥, g(x) = 2x 1 5 2. f(x) = x – 1, g(x) = x + 6 4. f(x) = 5x, g(x) = –5x 6 Lesson Quiz: Part II 5. f(x) = x, g(x) = x – 4 6. f(x) = –3x, g(x) = –x + 1 7. A cashier gets a $50 bonus for working on a holiday plus $9/h. The total holiday salary is given by the function f(x) = 9x + 50. How will the graph change if the bonus is raised to $75? if the hourly rate is raised to $12/h? p. 305: 21- 47 odd 7
