Teva Pharmaceuticals Stock Analysis
advertisement
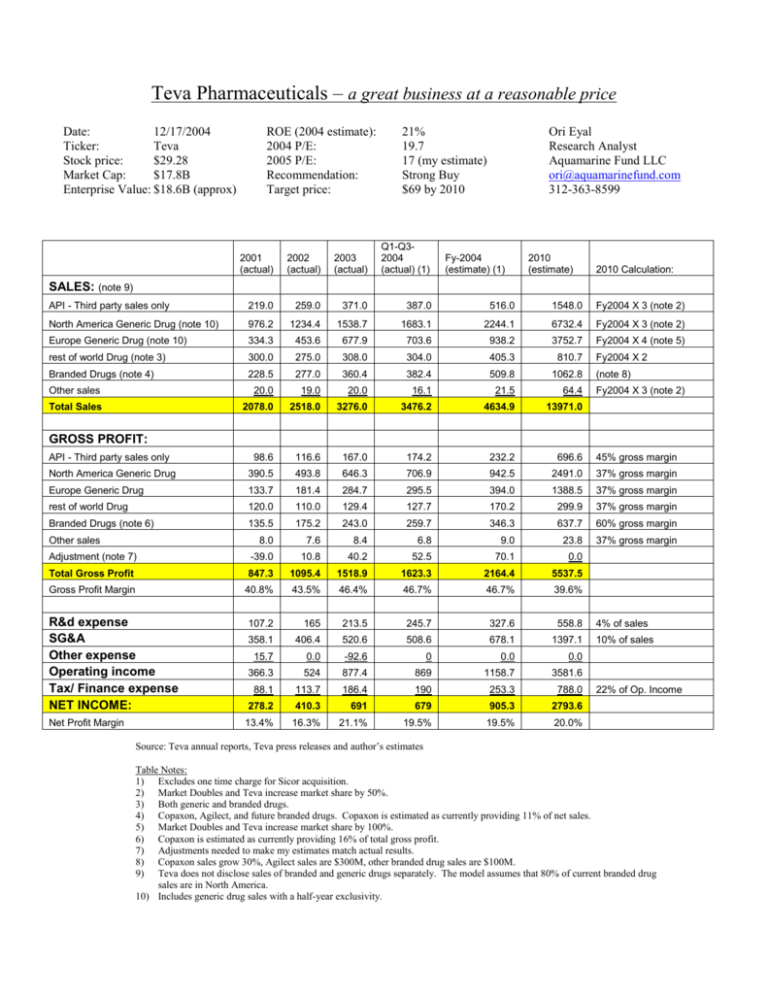
Teva Pharmaceuticals – a great business at a reasonable price Date: 12/17/2004 Ticker: Teva Stock price: $29.28 Market Cap: $17.8B Enterprise Value: $18.6B (approx) ROE (2004 estimate): 2004 P/E: 2005 P/E: Recommendation: Target price: 21% 19.7 17 (my estimate) Strong Buy $69 by 2010 Ori Eyal Research Analyst Aquamarine Fund LLC ori@aquamarinefund.com 312-363-8599 2001 (actual) 2002 (actual) 2003 (actual) Q1-Q32004 (actual) (1) API - Third party sales only 219.0 259.0 371.0 387.0 516.0 1548.0 Fy2004 X 3 (note 2) North America Generic Drug (note 10) 976.2 1234.4 1538.7 1683.1 2244.1 6732.4 Fy2004 X 3 (note 2) Europe Generic Drug (note 10) 334.3 453.6 677.9 703.6 938.2 3752.7 Fy2004 X 4 (note 5) rest of world Drug (note 3) 300.0 275.0 308.0 304.0 405.3 810.7 Branded Drugs (note 4) Fy-2004 (estimate) (1) 2010 (estimate) 2010 Calculation: SALES: (note 9) Fy2004 X 2 228.5 277.0 360.4 382.4 509.8 1062.8 Other sales 20.0 19.0 20.0 16.1 21.5 64.4 (note 8) Total Sales 2078.0 2518.0 3276.0 3476.2 4634.9 13971.0 98.6 116.6 167.0 174.2 232.2 696.6 45% gross margin North America Generic Drug 390.5 493.8 646.3 706.9 942.5 2491.0 37% gross margin Europe Generic Drug 133.7 181.4 284.7 295.5 394.0 1388.5 37% gross margin rest of world Drug 120.0 110.0 129.4 127.7 170.2 299.9 37% gross margin Branded Drugs (note 6) 135.5 175.2 243.0 259.7 346.3 637.7 60% gross margin 8.0 7.6 8.4 6.8 9.0 23.8 37% gross margin Adjustment (note 7) -39.0 10.8 40.2 52.5 70.1 0.0 Total Gross Profit 847.3 1095.4 1518.9 1623.3 2164.4 5537.5 Gross Profit Margin 40.8% 43.5% 46.4% 46.7% 46.7% 39.6% 107.2 165 213.5 245.7 327.6 558.8 4% of sales 358.1 406.4 520.6 508.6 678.1 1397.1 10% of sales 15.7 0.0 -92.6 0 0.0 0.0 366.3 524 877.4 869 1158.7 3581.6 Fy2004 X 3 (note 2) GROSS PROFIT: API - Third party sales only Other sales R&d expense SG&A Other expense Operating income Tax/ Finance expense NET INCOME: Net Profit Margin 88.1 113.7 186.4 190 253.3 788.0 278.2 410.3 691 679 905.3 2793.6 13.4% 16.3% 21.1% 19.5% 19.5% 20.0% 22% of Op. Income Source: Teva annual reports, Teva press releases and author’s estimates Table Notes: 1) Excludes one time charge for Sicor acquisition. 2) Market Doubles and Teva increase market share by 50%. 3) Both generic and branded drugs. 4) Copaxon, Agilect, and future branded drugs. Copaxon is estimated as currently providing 11% of net sales. 5) Market Doubles and Teva increase market share by 100%. 6) Copaxon is estimated as currently providing 16% of total gross profit. 7) Adjustments needed to make my estimates match actual results. 8) Copaxon sales grow 30%, Agilect sales are $300M, other branded drug sales are $100M. 9) Teva does not disclose sales of branded and generic drugs separately. The model assumes that 80% of current branded drug sales are in North America. 10) Includes generic drug sales with a half-year exclusivity. Executive Summary 1) We will attempt to take a high level overview of Teva and predict where it will be in 2010. 2) Teva is the best positioned generic drug company in the world in almost every respect – it has the best R&D, manufacturing, management, marketing, and pipeline. 3) Teva has several clear competitive advantages (see below) which will allow it resist pricing pressures and continue earning excess returns. 4) Teva’s US generic market share will grow 50% by 2010 (from 13% to 20%). 5) Teva’s European generic market share will grow 100% by 2010. 6) The entire generic drug market will double by 2010 (see below for explanation). 7) Teva’s API business will triple by 2010 (same growth rate as Teva’s US generic drug sales). 8) Teva’s branded drug business will double by 2010 (supported by launch of Rasagiline and new drugs in its “central nervous system franchise” – see below for explanation). 9) Gross profit margin decrease due to increased competition will be offset by greater economies of scale in R&D, Manufacturing, and SG&A. 10) Our model is fairly conservative and still shows sales and net income both growing at about 20% per year until 2010 (and beyond). This conclusion matches management guidance. 11) The expected sales growth in our model is verified using two separate estimation methods: Based on expected market growth and based on Teva’s drug pipeline. 12) Assuming a conservative P/E of 15 in 2010 and adding in the dividend yield, we get an annual compounded return of over 16% until 2010 and beyond. How the generic drug market works Drugs are a non-cyclical growing industry. People must purchase drugs regardless of the economic situation. The aggregate demand for drugs will continue to increase for the foreseeable future due to increasing demand from the aging baby boomers, ever increasing life expectancies, and the continues introduction of new drugs. Developing a new drug is an extremely expensive (~$800M) and lengthy (8+ years) process. Branded pharmaceutical companies go to this effort and expense to gain a temporary monopoly in selling their new drugs. In contrast, generic drug companies do not invent new drugs. They formulate a chemical equivalent of a branded drug and then file an ANDA (abbreviated new drug application) with the FDA. The ANDA need only show that the generic drug is chemically equivalent to the branded drug – there is no need to perform several phases of large clinical studies. For these reasons, a new generic drug is vastly cheaper and quicker to bring to market and is much more likely to be approved than a new branded drug. The first generic drug company that successfully challenges the patents of a branded drug (this is called a paragraph IV filing) gets a 6 month exclusivity period for marketing the generic drug. The generic company can usually use this 6 month period to make large profits and to capture market share. The generic drug industry is characterized by large economies of scale (especially in sales, marketing, manufacturing, and distribution). As a result, the industry has been consolidating in the past few years. It is likely that there will ultimately be only a few large generic companies in the world that control this market. Teva will certainly be one of these. About Teva Teva is one of the largest and the best positioned generic drug manufacturer in the world. It dominates the generic drug market in almost every respect and is expected to increase its market share in what is already a rapidly growing market. Headquartered in Israel, Teva’s main markets are in America and Europe. Teva enjoys first access to highly regarded Israeli pharmaceutical research through its strong connections with leading universities and research institutions in Israel. It also enjoys valuable tax incentives from Israel. Teva’s R&D is regarded as the best in the world. It has mastered the process of producing generic equivalents of branded drugs quickly and cheaply. Teva’s marketing arm is considered to be the largest and best among all generic drug companies and it has recently become even stronger with Teva’s acquisition of Sicor which has strong ties to the hospitals market. Copaxon, Teva’s only branded drug, is used to treat multiple sclerosis. This drug has been extremely profitable for Teva but is now facing new competition as its “orphan drug” status has expired. Teva will soon launch its second branded drug: Rasagiline (AKA: Agilect) and has other branded drugs in its pipeline. Teva is one of the worlds leading API (active pharmaceutical ingredients) manufactures. APIs are the active ingredients in drugs that actually make the drugs work. About half of Teva’s API sales are to Teva itself (through arms-length transactions). Teva’s Moat (competitive advantages) The generic drug market is incorrectly characterized as a commodity market. If this was true then no-one would buy a branded drug once a generic drug came out. In reality, there is significant brand loyalty in the drug market. In addition, Teva enjoys several competitive advantages that will allow it to earn excess returns: Large drug chains prefer to work with large branded drug companies (= Teva) that can provide them with a large selection of drugs. Teva’s marketing, R&D, and manufacturing are “the best in the world” and enjoy significant economies of scale. Teva enjoys significant tax breaks and first access to highly regarded research in Israel. Teva produces a large portion of its API’s for itself – thus having first access to API’s in limited supply. Teva’s generic drug pipeline dwarfs the pipelines of its competitors. Teva has several branded drugs in its pipeline that will help it establish its “central nervous system franchise”. Estimating the generic market growth rate In the US, total drug sales are around $200B per year. Of these, only about $16B are sales of generic drugs (even though 50% of all US prescriptions are for generic drugs). Current estimates expect about $80B of branded drugs to be exposed to generic competition by 2010 (Teva says this number may ultimately be higher than $100B). Competing generic drugs will then enter the market and drive the drug prices down by about 80%. This implies that the US generic drug market should increase by at least $80B * 20% = $16B by 2010 which means the US generic drug market will effectively double its size. In Europe and elsewhere, the markets for generic drugs are not as well developed now but are rapidly developing and should more than double their size by 2010. Projecting Teva’s future market share and sales growth US Generic drugs Teva currently controls 13% of the US generic drug market. As we have seen, this market is expected to at least double by the year 2010. Teva’s positioning and drug pipeline are so much stronger that other generic drug manufacturers, that it is almost certain to increase its share of the US market by 50% by 2010. This leads us to expect Teva’s generic US sales to more than triple by 2010. European Generic drugs Teva currently controls a small portion of the European generic drug market. As we have seen, this market is expected to at least double by the year 2010. Teva’s management has said that: “Teva is about to do to Europe what it did to the US”. This statement plus Teva’s very strong positioning leads us to expect that Teva will double its European generic market share by 2010. This leads us to expect Teva’s European generic sales to quadruple (X4) by 2010. API’s We conservatively estimate that Teva’s API sales will grow at the same rate as its generic US sales (triple by 2010). Branded drugs Assuming that Copaxon sales growth slows significantly due to new competition, we conservatively estimate Copaxon sales will increase by only 30% by 2010. We add an estimated $300M of sales from Teva’s new branded drug Agilect and another $100M of sales from future branded drugs in Teva’s pipeline and get total branded drug sales by 2010 of $1.06B. Teva’s generic pipeline Using Teva’s generic drug pipeline will give us a separate estimate of Teva’s growth prospects that will confirm our earlier estimates. Teva’s generic pipeline contains 119 drug filings with US brand sales of approximately $75B. A large portion of these have been filed under paragraph IV. Teva’s generic pipeline dwarfs the pipeline of its competitors (it is over twice as large as the pipeline of its closest competitor). The sheer size and scope of Teva’s pipeline supports the thesis that Teva will greatly increase its generic market share in the future. Almost all of Teva’s pipeline will be brought to market sometime in the next 6 years. Assuming that drug prices fall to 20% of their branded drug level and that Teva captures 30% of the drug sales from drugs in its pipeline we get additional Teva sales of $75B * 20% * 30% = $4.5B. This calculation is actually very conservative since it completely ignores the additional sales and profits from successful paragraph IV filings in the Pipeline – current estimates are that about 1/5 of the pipeline may receive a paragraph IV half-year exclusivity. This “pipeline potential” calculation shows US generic drug sales growing by about $4.5B by 2010. This number supports our earlier estimates of US generic drug sales growing by $4.5B which we calculated by assuming the entire market doubles and Teva increases its market share by 50%. Note that Teva has a separate pipeline for Europe but does not disclose its exact size. Management team Teva is led by Israel Makov (President and CEO) and Eli Hurvitz (Chairman of the board). This highly competent management team is shareholder friendly and has consistently under promised and over delivered. They project annual sales and earnings growth of 20% for the foreseeable future and have said that “Teva is about to do to Europe what it did to the US”. Valuation Teva will likely have net income of about $2.794B in 2010 (see model). Assuming a conservative P/E of 15 at that time, we get a market cap of $41.85B in 6 years. Adding in the current dividend yield, this translates into an annual compounded return of 16% until 2010 and beyond. The threat of authorized generics In an attempt to fight generic companies, branded drug companies often launch an “authorized generic” drug at the same time that a paragraph IV exclusivity period begins. Many industry analysts have focused on this threat and concluded that the generic drug business will be severely hurt by it. While authorized generics are clearly bad for Teva, we feel that the market has overreacted to this development and has thus created an investment opportunity. Only about 20% of Teva’s generic drug pipeline is even filed under paragraph IV so clearly, non-exclusive generic drugs (which are not affected by authorized generics) are also very profitable. Teva’s plans and guidance already assume a worst case scenario (“authorized generic” for every paragraph IV drug Teva launches). Ultimately, an authorized generic is just one more competing generic drug. To date, Teva has been able to resist the impact of authorized generics and has maintained a gross margin for US generic drugs in 2004 of 42% (authors estimate). In order to be conservative, our model assumes gross margins for generic drugs will drop to 37% by 2010. We also completely ignore any additional generic drug sales from paragraph IV filings. Despite these conservative assumptions, our model shows that any gross margin decreases due to increased competition will be offset by increasing economies of scale in R&D, manufacturing, marketing and SG&A. Running our model using a “doomsday” scenario where generic drug gross margins drop to 30% still shows an annual compounded return of over 11% up to 2010 and beyond. The bear case (possible risks) Teva’s share price has dropped from a high of $34 to a low of $24 in the past few months along with share price drops for the entire pharmaceuticals industry. Most bears raise 4 arguments against investing in Teva: 1) The generic drug market is a commodity market where price is the main differentiating factor. Competition is now increasing on all fronts and this will erode profit margins. 2) New “authorized generics” are changing the business. 3) New competition for Copaxon will hurt Teva. 4) There are no immediate catalysts for the stock. A brief response to these arguments is: 1) Unlike commodity markets, the drug market does exhibit strong product loyalty (otherwise no one would buy a branded drug once a cheaper generic equivalent was introduced). The first company to introduce a new generic drug often captures market share that persists even when more generic drugs are introduced. Teva enjoys several significant competitive advantages that will allow it to continue earnings excess returns. Even under very severe competition, Teva would be “the last man standing” and would then be able to purchase competitors at a low price. 2) This issue has been addressed above. 3) Copaxon’s relative importance for Teva is decreasing as Teva’s business lines expand. It is also launching new branded drugs that will experience strong growth even as Copaxon’s growth slows. 4) By 2010 (and before), Teva’s very strong performance will be reflected in its stock price even if there are no catalysts in the immediate future.
