Lesson 6: Part I - Potential energy diagrams of Reaction
Lesson 6: Part I - Potential energy diagrams of Reaction Mechanisms
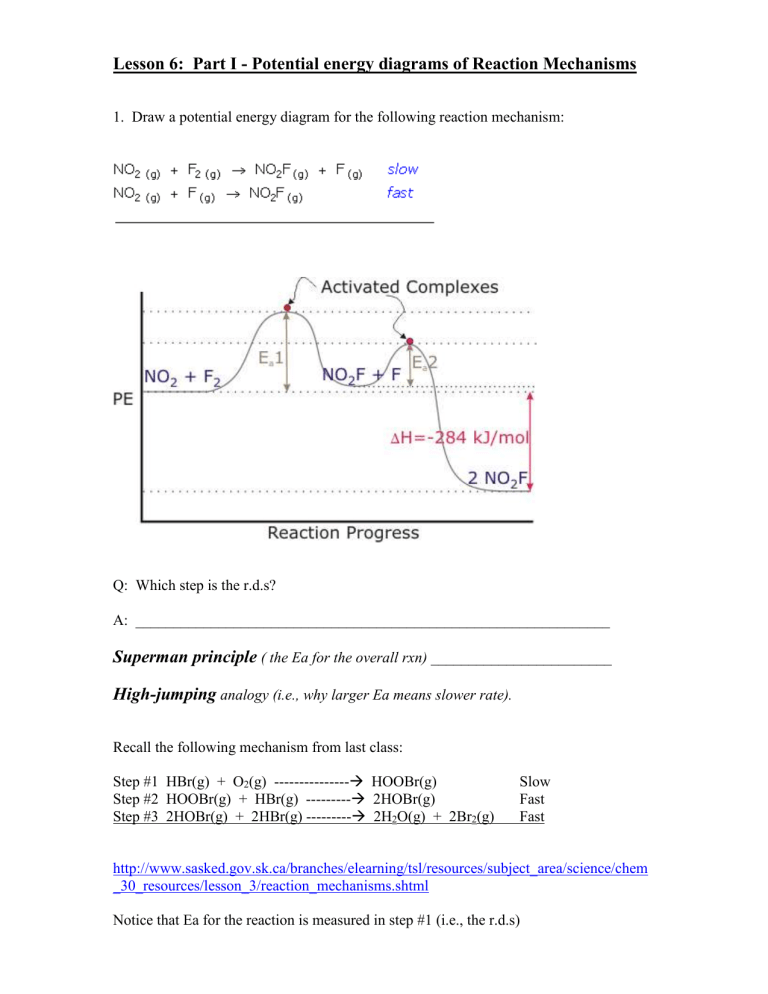
1. Draw a potential energy diagram for the following reaction mechanism:
Q: Which step is the r.d.s?
A: _______________________________________________________________
Superman principle
( the Ea for the overall rxn) ________________________
High-jumping
analogy (i.e., why larger Ea means slower rate).
Recall the following mechanism from last class:
Step #1 HBr(g) + O
2
(g) ---------------
HOOBr(g)
Step #2 HOOBr(g) + HBr(g) ---------
2HOBr(g)
Slow
Fast
Step #3 2HOBr(g) + 2HBr(g) ---------
2H
2
O(g) + 2Br
2
(g) Fast http://www.sasked.gov.sk.ca/branches/elearning/tsl/resources/subject_area/science/chem
_30_resources/lesson_3/reaction_mechanisms.shtml
Notice that Ea for the reaction is measured in step #1 (i.e., the r.d.s)
2.
Draw a P.E profile for the following:
Step #1:
Step #2:
Total:
NO
2
(g) + SO
2
(g) ---------
SO
3
(g) + NO(g) fast
NO (g) + 1/2O
2
(g) ---------
NO
2
(g) slow
-------
∆H = +25kJ
Label:
1.
Reactants and Products
2.
Activated complexes
3.
The r.d.s
4.
The Ea for the overall rxn and the Ea (rev)
5.
The Enthalpy
3. Consider this potential energy diagram for a three-step reaction mechanism: a.
Which arrow indicates the enthalpy change (
Δ
H) or "enthalpy change" for the overall forward reaction? b.
Which arrow indicates the enthalpy change (
Δ
H) or "enthalpy change" for the overall reverse reaction? c.
Which arrow indicates the activation energy for the overall forward reaction? d.
Which step is the rate determining step in the forward reaction?
Part II: Kinetic Energy Diagrams
Ultimately, the speed of a reaction depends on the total number of particles that have greater than threshold energy. Even if we had several trillion particles, a rxn would not occur if none of them had sufficient energy.
A K.E. diagram is a distribution curve showing the energy of the reacting particles.
Increasing Temperature
Q: The rule for an increase in 10 o
C for a slow reaction?
A: ___________________________________________________________
Q: Why?
A: ___________________________________________________________
Increasing Concentration
Q: What would happen to the total number A’s in our class if our class size was ten times larger?
A: ________________________________________________________________
Q: Using the same reasoning, what would happen to the total number of particles that were considered higher than threshold energy if we had a much higher concentration of particles to start with?
A:______________________________________________________________________
________________________________________________________________________
Consider the K.E diagram when concentration changes.
# of particles
K.E
The percentage of particles in both distributions is the same, but the total number of particles that have sufficient energy to react has increased for the larger concentration.
Increasing Surface Area
Q: What effect does increasing surface area have on the kinetic energy distribution diagram?
A:______________________________________________________________________
________________________________________________________________________
Adding a Catalyst
Q: What effect would a catalyst have on a K.E. curve?
A:______________________________________________________________________
________________________________________________________________________
