Instrumentation Labs Name: Page 1 of 17 Which Food Coloring Dye
advertisement
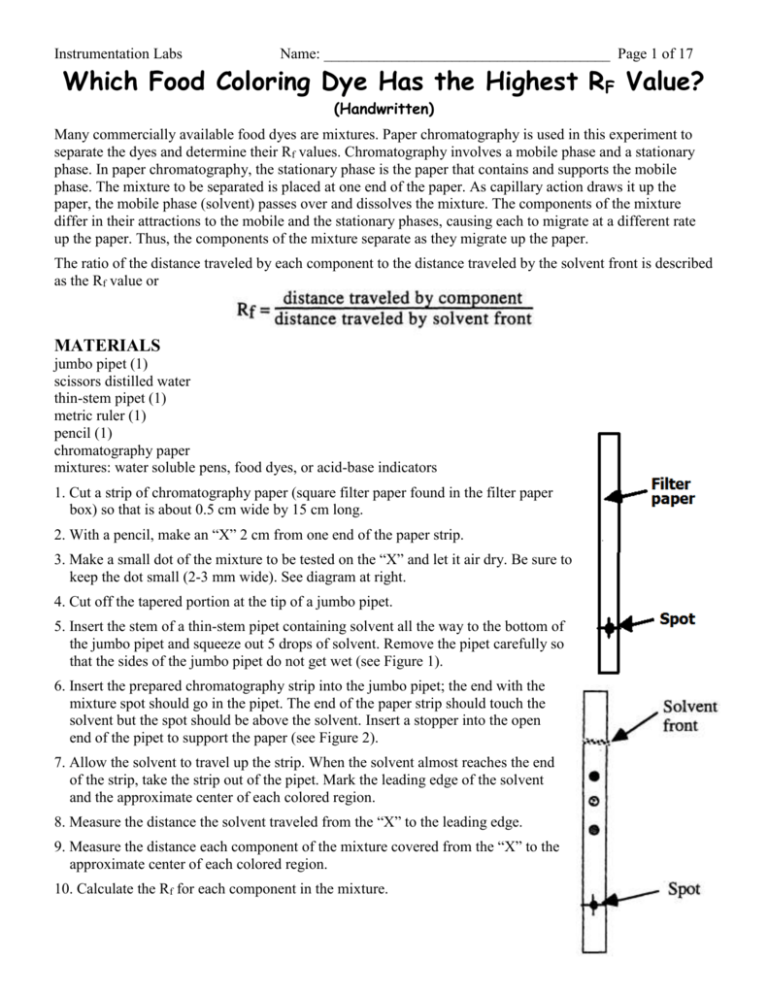
Instrumentation Labs Name: ______________________________________ Page 1 of 17 Which Food Coloring Dye Has the Highest RF Value? (Handwritten) Many commercially available food dyes are mixtures. Paper chromatography is used in this experiment to separate the dyes and determine their Rf values. Chromatography involves a mobile phase and a stationary phase. In paper chromatography, the stationary phase is the paper that contains and supports the mobile phase. The mixture to be separated is placed at one end of the paper. As capillary action draws it up the paper, the mobile phase (solvent) passes over and dissolves the mixture. The components of the mixture differ in their attractions to the mobile and the stationary phases, causing each to migrate at a different rate up the paper. Thus, the components of the mixture separate as they migrate up the paper. The ratio of the distance traveled by each component to the distance traveled by the solvent front is described as the Rf value or MATERIALS jumbo pipet (1) scissors distilled water thin-stem pipet (1) metric ruler (1) pencil (1) chromatography paper mixtures: water soluble pens, food dyes, or acid-base indicators 1. Cut a strip of chromatography paper (square filter paper found in the filter paper box) so that is about 0.5 cm wide by 15 cm long. 2. With a pencil, make an “X” 2 cm from one end of the paper strip. 3. Make a small dot of the mixture to be tested on the “X” and let it air dry. Be sure to keep the dot small (2-3 mm wide). See diagram at right. 4. Cut off the tapered portion at the tip of a jumbo pipet. 5. Insert the stem of a thin-stem pipet containing solvent all the way to the bottom of the jumbo pipet and squeeze out 5 drops of solvent. Remove the pipet carefully so that the sides of the jumbo pipet do not get wet (see Figure 1). 6. Insert the prepared chromatography strip into the jumbo pipet; the end with the mixture spot should go in the pipet. The end of the paper strip should touch the solvent but the spot should be above the solvent. Insert a stopper into the open end of the pipet to support the paper (see Figure 2). 7. Allow the solvent to travel up the strip. When the solvent almost reaches the end of the strip, take the strip out of the pipet. Mark the leading edge of the solvent and the approximate center of each colored region. 8. Measure the distance the solvent traveled from the “X” to the leading edge. 9. Measure the distance each component of the mixture covered from the “X” to the approximate center of each colored region. 10. Calculate the Rf for each component in the mixture. Instrumentation Labs Name: ______________________________________ Page 2 of 17 ANALYSIS 1. Distance traveled by the solvent: __________ 2. List the color of each component and the, distance traveled. Color of Component Distance Traveled by Component 3. Calculate the Rf value for each component. Show your work. 4. Why should one not use an ink pen or other similar marker to mark the starting point? 5. If a particular component had a greater attraction for the paper than it did for the solvent, would you expect the component to be near the origin or the top of the paper after allowing the chromatogram to form? 6. If one component has an Rf value of 0.64 and another component has an Rf of 0.87, how far apart would the two components be from each other after the solvent has traveled 12.0 cm? Show your work. Instrumentation Labs Name: ______________________________________ Page 3 of 17 Can You Determine the Flame Tests of the Elements: (Save the last page of this file with pictures and questions answered and email to me) The atomic spectrum of an element results when sufficient energy is supplied to cause some electrons to move to higher energy levels, and then lose this energy as bursts of energy called “photons.” While electrons are in higher-than-normal energy levels, atoms are said to be in “excited states.” Excited states are usually very unstable and quickly return to normal or ground states. Since the energy levels are determined by the structure of the atom, energy is lost in discrete amounts equivalent to the difference of the associated energy levels. Each element has a unique number of protons and electrons, and has a large number of possible excited states. When atoms or ions in the ground state are heated to high temperatures, some of the electrons absorb enough energy to allow them to “jump” to higher energy levels. This “excited state” electron configuration is unstable and the electrons “fall” back to their normal positions of lower energy. As the electrons return to their ground state configurations, the energy that was absorbed is emitted in the form of electromagnetic energy called “photons.” Most of the photons are not visible to the human eye. Some metal salts do produce characteristic colored flames. The color of this light can then be used to identify the elements involved. These tests are called flame tests. Only metals with their loosely held electrons are excited in a flame. Thus, flame tests are useful in the identification of these metallic ions. Many metallic salts exhibit characteristic colors when vaporized in a flame. In this experiment, these salts have been dissolved in highly flammable methyl alcohol: You will place a small amount of the solution in one of the wells of your 24-well plate, place a Q-tip in the well, and light the mixture with a match. Record the colors of the various flames on the data table and once everyone is finished with the experiment, identify the two unknown solutions on the lecture table. MATERIALS 24-well plate Q-tips thin-stem pipets with various metallic salts dissolved in methyl alcohol. PROCEDURE Caution: Put on your goggles now!! 1. Get a 24-well plate and place about 1 mL of each of the various salt solutions in different wells in your plate. Notice that each well has a number and a letter. Use this code to identify which salt is in each well. Do this experiment at the back left lab table and turn on the vent fan. When you finish the lab, turn off the vent fan. 2. Dip one end of a clean Q-tip into one of the solutions. Light the Q-tip with a lighter and record the color of the flame on the data table. Have your lab partner take a picture of at least one chemical while it burns. Choose the most dramatic colors. 3. Repeat step 2 until you have tested all the various salt solutions provided. 4. Select two of the unknowns: one from group A, which contains only one salt in the alcohol, and one from group B, which contains two ions. Instrumentation Labs Name: ______________________________________ Page 4 of 17 Data Table Metallic Ion Color Metallic Ion Na+ Ba+2 K+ Mg+2 Li+ Co+2 Ca+2 Ni++ Sr+2 Cu+2 Unknown # ______ Unknown # ______ Color QUESTIONS 1. According to your observations, which metal ion is present in your unknown sample? 2. Why does only one of these ions (Co, Cu, or Ni) produce a positive flame test? 3. Explain how the colors observed in the flame tests are produced. 4. What are some useful applications for the colored flame produced when the alkali and alkaline earth elements are heated? Save this page and email the file to me with your pictures inserted or your video file. Instrumentation Labs Name: ______________________________________ Page 5 of 17 Partner 1 do this. Determining the Concentration of a Solution: Beer’s Law (email graphs and the last page of this file to me.) The primary objective of this experiment is to determine the concentration of an unknown copper (II) sulfate solution. You will use a Colorimeter (a side view is shown in Figure 1) to measure the concentration of each solution. In this experiment, red light from the LED light source will pass through the solution and strike a photocell. A higher concentration of the colored solution absorbs more light (and transmits less) than a solution of lower concentration. The Colorimeter monitors the light received by the photocell as percent transmittance. Figure 1 You will prepare five copper (II) sulfate solutions of known concentration (standard solutions). Each solution is transferred to a small, rectangular cuvette that is placed into the Colorimeter. The amount of light that penetrates the solution and strikes the photocell is used to compute the absorbance of each solution. When you graph absorbance vs. concentration for the standard solutions, a direct relationship should result. The direct relationship between absorbance and concentration for a solution is known as Beer’s law. You will determine the concentration of an unknown CuSO4 solution by measuring its absorbance with the Colorimeter. By locating the absorbance of the unknown on the vertical axis of the graph, the corresponding concentration can be found on the horizontal axis. The concentration of the unknown can also be found using the slope of the Beer’s law curve. OBJECTIVES In this experiment, you will Prepare and test the absorbance of five standard copper (II) sulfate solutions. Calculate a standard curve from the test results of the standard solutions. Test the absorbance of a copper (II) sulfate solution of unknown molar concentration. Calculate the molar concentration of the unknown CuSO4 solution. MATERIALS Vernier computer interface computer Vernier Colorimeter one cuvette five 20 × 150 mm test tubes two 10 mL pipets or graduated cylinders two 100 mL beakers 0.40 M copper (II) sulfate, CuSO4, solution copper (II) sulfate, CuSO4, unknown solution pipet pump or pipet bulb distilled water test tube rack stirring rod tissues (preferably lint-free) Instrumentation Labs Name: ______________________________________ Page 6 of 17 PROCEDURE 1. Obtain and wear goggles. 2. Obtain small volumes of 0.40 M CuSO4 solution and distilled water in separate beakers. 3. Label four clean, dry, test tubes 1–4. Use pipets to prepare five standard solutions according to the chart below. Thoroughly mix each solution with a stirring rod. Clean and dry the stirring rod between uses. Trial number 1 2 3 4 5 0.40 M CuSO4 (mL) 2 4 6 8 ~10 Distilled H2O (mL) Concentration (M) 8 6 4 2 0 0.080 0.16 0.24 0.32 0.40 4. Connect a Colorimeter to Channel 1 of the Vernier computer interface. Connect the interface to the computer using the proper cable. 5. Start the Logger Pro program on your computer. Open the file “17 Colorimeter” from the Advanced Chemistry with Vernier folder. 6. Calibrate the Colorimeter. a. Prepare a blank by filling an empty cuvette ¾ full with distilled water. Place the blank in the cuvette slot of the Colorimeter and close the lid. b. If your Colorimeter has a CAL button, set the wavelength on the Colorimeter to 635 nm, press the CAL button, and proceed directly to Step 7. If your Colorimeter does not have a CAL button, continue with this step to calibrate your Colorimeter. c. Choose Calibrate CH1: Colorimeter from the Experiment menu, then click . d. Turn the wavelength knob on the Colorimeter to the “0% T” position. e. Type 0 in the edit box. f. When the displayed voltage reading for Reading 1 stabilizes, click . g. Turn the knob of the Colorimeter to the Red LED position (635 nm). h. Type 100 in the edit box. i. When the voltage reading for Reading 2 stabilizes, click , then click . 7. You are now ready to collect absorbance-concentration data for the five standard solutions.Click . a. Remove the cuvette from your Colorimeter and pour out the water. Using the solution in Test Tube 1, rinse the cuvette twice with ~1 mL amounts, and then fill it ¾ full. Wipe the outside with a tissue, place it in the Colorimeter, and close the lid. b. When the absorbance readings stabilize, click , type “0.080” in the edit box, and press the ENTER key. The data pair should now be plotted on the graph. c. Discard the cuvette contents as directed. Using the solution in Test Tube 2, rinse and fill the cuvette ¾ full. Wipe the outside, place it in the Colorimeter, and close the lid. When the absorbance readings stabilize, click , type “0.16” in the edit box, and press the ENTER key. d. Repeat the procedure for Test Tubes 3 and 4. Trial 5 is the original 0.40 M CuSO4 solution. Note: Do not test the unknown solution until Step 9. e. When you have finished testing the standard solutions, click . f. Examine the graph of absorbance vs. concentration. Click the Linear Regression button, . A best-fit linear regression line will be shown for your five data points. 8. Record the absorbance values, for each of the five trials, in your data table. Instrumentation Labs Name: ______________________________________ Page 7 of 17 9. Determine the absorbance value of the unknown CuSO4 solution. a. Obtain about 5 mL of the unknown CuSO4 in another clean, dry, test tube. Record the number of the unknown in your Data Table. b. Rinse the cuvette twice with the unknown solution and fill it about ¾ full. Wipe the outside of the cuvette, place it into the Colorimeter, and close the lid. c. Read the absorbance value displayed in the meter. (Important: The reading in the meter is live, so it is not necessary to click to read the absorbance value.) When the displayed absorbance value stabilizes, record its value as Trial 6 in your data table. d. Dispose of any of the remaining solutions as directed. DATA TABLE Trial Concentration (mol/L) 1 0.080 2 0.16 3 0.24 4 0.32 5 0.40 6 Unknown number ____ Absorbance DATA ANALYSIS 1. Calculate the linear regression (best-fit line) equation of absorbance vs. concentration for the five standard CuSO4 solutions. Email a graph showing the data and linear-regression equation for the standard solutions. Also email the answers to these questions to me and your report. 2. Determine the concentration of the unknown CuSO4 solution. Explain how you made this determination. 3. Use the internet to research Beer’s Law, explain the premise of Beer’s Law, show formulas, and find ways that scientists use Beer’s Law. Do at least a ½ page report single spaced, 12 pt, 1 inch margins. Instrumentation Labs Partner 2 do this: Law (You Name: ______________________________________ Page 8 of 17 Determining the Concentration of a Solution: Beer’s will be emailing graphs and the last page of this file to me.) The primary objective of this experiment is to determine the concentration of an unknown nickel (H) sulfate solution. You will be using the Colorimeter shown in Figure 1. In this device, red light from the LED light source will pass through the solution and strike a photocell. The NiSO4 solution used in this experiment has a deep green color. A higher concentration of the colored solution absorbs more light and transmits less light than a solution of lower concentration. The computer-interfaced colorimeter monitors the light received by the photocell as either an absorbance or a percent transmittance value. You are to prepare five nickel sulfate solutions of known concentration (standard solutions). Each is transferred to a small, rectangular curvette that is placed into the colorimeter. The amount of light that penetrates the solution and strikes the photocell is used to compute the absorbance of each solution. When a graph of absorbance vs. concentration is plotted for the standard solutions, a direct relationship should result, as shown in Figure 2. The direct relationship between absorbance and concentration for a solution is known as Beer’s law. The concentration of an unknown NiSO4 solution is then determined by measuring its absorbance with the colorimeter. By locating the absorbance of the unknown on the vertical axis of the graph, the corresponding concentration can be found on the horizontal axis (follow the arrows in Figure 2). The concentration of the unknown can then be found using the slope of the Beer’s law curve. MATERIALS Macintosh or IBM-compatible computer Serial Box Interface or ULI LoggerPro Vernier Colorimeter one cuvette five 20 x 150 mm test tubes tissues (preferably lint-free) stirring rod 30 mL of 0.40 M NiSO4 5 mL of NiSO4 unknown solution two l0-mL graduated cylinders distilled water test tube rack two l00-mL beakers Instrumentation Labs Name: __________________________________Page 9 of 17 PROCEDURE 1. Obtain and wear goggles! CAUTION: Be careful not to ingest any NiSO4 solution or spill any on your skin. Inform your teacher immediately in the event of an accident. 2. Add about 30 mL of 0.40 M NiSO4 stock solution to a 100-mL beaker. Add about 30 mL of distilled water to another 100-mL beaker. 3. Label four clean, dry, test tubes 1-4 (the fifth solution is the beaker of 0.40 M NiSO4). Pipet 2,4, 6, and 8 mL of 0.40 M NiSO4 solution into Test Tubes 1-4, respectively. With a second pipet, deliver 8, 6, 4, and 2 mL of distilled water into Test Tubes 1-4, respectively. Thoroughly mix each solution with a stirring rod. Clean and dry the stirring rod between stirrings. Keep the remaining 0.40 M NiSO4 in the 100-mL beaker to use in the fifth trial. Volumes and concentrations for the trials are summarized below: Trial Number 0.40M NiSO4 (mL) H2O (mL) Concentration (M) 1 2 8 0.08 2 4 6 0.15 3 6 4 0.24 4 8 2 0.32 5 10 0 0.40 4. Prepare the computer for data collection by opening “Exp 11” from the Chemistry with Computers Logger experiment files of LoggerPro. The vertical axis has absorbance scaled from 0 to 0.6. The horizontal axis has concentration scaled from 0 to 0.5 mol/L. 5. You are now ready to calibrate the colorimeter. Prepare a blank by filling a cuvette 3/4 full with distilled water. To correctly use a colorimeter cuvette, remember: • All cuvettes should be wiped clean and dry on the outside with a tissue. • Handle cuvettes only by the top edge of the ribbed sides. • All solutions should be free of bubbles. • Always position the cuvette with its reference mark facing toward the white reference mark at the right of the cuvette slot on the colorimeter. Choose Calibrate from the Experiment menu and then click . Place the blank cuvette in the cuvette slot of the colorimeter and close the lid. Turn the wavelength knob of the colorimeter to the 0%T position. In this position, the light source is turned off, so no light is received by the photocell. Type “0” in the % edit box. When the displayed voltage reading for Input 1 stabilizes, click . For Reading 2, turn the wavelength knob of the colorimeter to the Red LED position (635 nm). In this position, the colorimeter is calibrated to show 100% of the red light being transmitted through the blank cuvette. Type “100” in the % edit box. When the displayed voltage reading for Input 1 stabilizes, click , then click . 6. You are now ready to collect absorbance data for the five standard solutions. Click . Empty the water from the cuvette. Using the solution in Test Tube 1, rinse the cuvette twice with 1-mL amounts and then fill it 3/4 full. Wipe the outside with a tissue and place it in the colorimeter. After closing the lid, wait for the absorbance value displayed on the monitor to stabilize. Then click , type “0.080” in the edit box, and press the ENTER key. The data pair you just collected should now be plotted on the graph. 7. Discard the cuvette contents as directed by your teacher. Rinse the cuvette twice with the Test Tube 2 solution, 0.16 M NiSO4, and fill the cuvette 3/4 full. Wipe the outside place it in the colorimeter, and close Instrumentation Labs Name: __________________________________Page 10 of 17 the lid. When the absorbance value stabilizes, click ENTER key. type “0.16” in the edit box, and press the 8. Repeat the Step 7 procedure to save and plot the absorbance and concentration values of the solutions in Test Tube 3 (0.24 M) and Test Tube 4(0.32 M), as well as the stock 0.40 M NiSO4. Wait until Step 12 to do the unknown. When you have finished with the 0.40 M NiSO4 solution, click . 9. In your Data and Calculations table, record the absorbance and concentration data pairs that are displayed in the Table window. 10. Examine the graph of absorbance versus concentration. To see if the curve resents a direct relationship between these two variables, click the Linear Regression button . A best-fit linear regression line will be shown for your five data points. This line should pass near or through the data points and the origin of the graph. (Note: Another option is to choose Curve Fit from the Analyze menu, and then select Proportional. The Proportional fit (y = Ax) has a y-intercept value equal to 0; therefore, this regression line will always pass through the origin of the graph). 11. Obtain about 5 mL of the unknown NiSO4 in another clean, dry, test tube. Record the number of the unknown in the Data and Calculations table. Rinse the cuvette twice with the unknown solution and fill it about 3/4 full. Wipe the outside of the cuvette, place it into the colorimeter, and close the lid. Read the absorbance value displayed in the Meter window. (Important: The reading in Meter window is live, so it is not necessary to click to read the absorbance value.) When the displayed absorbance value stabilizes, record its value in Trial 6 of the Data and Calculations table. 12. Discard the solutions as directed by your teacher. Proceed directly to Steps 1 and 2 of Processing the Data. 13. You will get a different unknown from me.Trial Concentration 1 0.080 _________ 2 0.16 _________ 3 0.24 _________ 4 0.32 _________ 5 0.40 _________ 6 (mol/L) Unknown Number ________ Concentration of the Unknown Absorbance _________ _________ mol/L PROCESSING THE DATA (use email to submit.) 1. Use the following method to determine the unknown concentration. With the linear regression curve still displayed on your graph, choose Interpolate from the Analyze menu. A vertical cursor now appears on the graph. The cursor’s x and y coordinates are displayed at the bottom of the floating box (x is concentration and y is absorbance). Move the cursor along the regression line until the absorbance (y) value is approximately the same as the absorbance value you recorded in Step 11. The corresponding x value is the concentration of the unknown solution, in mol/L. Instrumentation Labs Name: __________________________________Page 11 of 17 2. Email a graph of absorbance vs. concentration, with a regression line and interpolated unknown concentration displayed. Email a copy of the Graph window. Also email the answers to these questions to me and your report. Enter your name(s) and the number of copies of the graph you want. 3. Use the internet to research Beer’s Law, explain the premise of Beer’s Law, show formulas, and find ways that scientists use Beer’s Law. Do at least a ½ page report single spaced, 12 pt, 1 inch margins. Instrumentation Labs Name: __________________________________Page 12 of 17 Liquid Chromatography (email) Preliminary Lab Assignment (Place your cursor in the blank line after each question and type your answers. Save the file and email the file to me. You should delete the parts that you have no answer on. What your should have is 5 question on page 1, data table page 5, and questions on page 6.) 1. What is the process of chromatography used for? 2. In chromatography, components of a mixture spend some time adsorbed on a stationary phase and some time dissolved in a mobile phase. Explain how the components can be separated with these two phases. 3. In the liquid chromatography column used in this experiment, the solid has a C18 hydrocarbon bonded to it. Would a C 18 hydrocarbon be a polar or a nonpolar substance? Explain. 4. The Kool-Aid® that is to be separated in this experiment consists of citric acid, calcium phosphate, salt, maltodextrin, artificial flavor, ascorbic acid, FD&C Red #40 and FD&C Blue #1 dyes. Group these as very polar, moderately polar, or nonpolar. 5. Suggest a different mixture for which liquid chromatography might be a useful separation tool. Liquid Chromatography In this experiment we will use liquid chromatography to separate the substances that are present in grape flavored Kool-Aid®. First, the dyes FD&C Blue #1 and Red #40 will be separated. The other components of Kool-Aid®, the flavorings and citric acid, will be separated in a second experiment. Chromatography is an important analytical tool that is used to separate the components of a mixture. Liquid chromatography is one type of chromatography that is enormously useful in research and in industry. High performance liquid chromatography (HPLC) has become an almost indispensable tool for scientists. There are many kinds of chromatography, but all have some elements in common. First, there is a stationary support medium which attracts the components of the mixture. This medium may be polar, attracting polar components of the mixture, or nonpolar, attracting the nonpolar components. In liquid chromatography, this support is a column packed with a fine, granular solid. The mixture to be separated is placed in the column and clings to the solid. The second necessary component is a solvent which washes along the column. This solvent has a different polarity than the solid. The components of the mixture may be more strongly attracted to the solvent or to the stationary support, depending on their polarity. As the solvent washes through the column, the components of the mixture spend some time adsorbed on the stationary support and some time dissolved in the moving solvent. The substances that are more soluble in the solvent travel more quickly through the column, and emerge early. Those substances that are more strongly attracted to the stationary support move slowly, and emerge later. A C18 Sep-Pak® cartridge is the column that will be used in this experiment. This column is packed with a silica solid which has a C18 hydrocarbon bonded to it, so it is very nonpolar. Instrumentation Labs Name: __________________________________Page 13 of 17 A third component of chromatography is that a means of injecting the sample into the column is required. We will use a disposable hypodermic syringe. Fourth, a pump is needed to force the solvent through the column. We will use a syringe or plastic squeeze bottle. Next, a detector is required to tell when the components emerge from the column. Since we will be separating colored dyes, we can use our eyes to see the dyes as they emerge from the column. The recording of the experiment will be done manually with pen and a laboratory notebook. Figure 1. Components of Mixture Moving through Liquid Chromatography Column When a mixture is injected into the liquid chromatography column and washed through it, several processes occur. Refer to Figure 1. The more polar components of the mixture are attracted more strongly to the solvent, so they will move more quickly through the column with the solvent. The less polar components will move more slowly, as they spend more time adsorbed to the column medium. Ideally, the components should emerge at different times. A measure of the degree of separation that is achieved is called the resolution of the system. A second process that occurs which works against resolution is that as the band of each component moves down the column, the band widens due to diffusion. As bands widen they overlap each other more easily and prevent clean separation or resolution of the components. Chemicals Isopropanol, C3H7OH, 70% or 91%, colorless, unscented Grape Kool-Aid®, or other grape drink, unsweetened Equipment Sep-Pak® C 18 cartridge (Draw in my desk) Graduated cylinders, 10-mL and 25-mL Beakers, 4, 50-mL or 10-niL Beakers, 4, 100-mL Syringe, 1 mL or 2 mL with male Luer® tip Syringe, 10-mL with male Luer® tip, or 50-mL or 1 00-mL dropper bottles with plastic tips, or 100-mL or 250-mL wash bottles Instrumentation Labs Name: __________________________________Page 14 of 17 Procedure Safety Alert Isopropyl alcohol is flammable. Keep it away from flames. Wear Chemical Splash Goggles and a Chemical-Resistant Apron. Isocratic separation In an isocratic separation, the solvent composition and flow rate are held constant throughout the experiment. The solvent composition is chosen to be able to elute both of the dyes in the grape drink at different rates. In an isocratic separation, the resolution, selectivity and efficiency of the separation can be calculated. 1. Prepare Kool-Aid®. Prepare the grape Kool-Aid® as directed on the package, but omit the sugar. To prepare less than a whole package, use 0.5 g/250 mL water. 2. Prepare the isopropanol Eluant. Prepare 18% (v/v) isopropanol in water to be used as the mobile phase. Combine 13 mL of 70% isopropanol with 37 mL distilled water (or 10 mL 91% isopropanol with 40 mL distilled water). 3. Pretreat the C18 Sep-Pak® cartridge. To help eliminate remixing of closely eluting bands in the cartridge, cut off the exit tube of the cartridge (the shorter end) at the point where it meets the body of the cartridge. Pre-wet the cartridge by pumping about 10 mL of undiluted (70% isopropanol) through the cartridge. If you are using a syringe, fill it with 10 mL of the undiluted isopropanol. Attach the tip to the long end of the Sep-Pak® cartridge, and pump the isopropanol through the syringe at a rate of 5—10 mL per minute. Collect the eluted alcohol in a 10 mL graduated cylinder to monitor the flow rate. If you are using a plastic bottle with a pointed dropper top or a wash bottle, attach the top of the filled bottle firmly to the cartridge, and slowly pump the isopropanol through the cartridge. Next, wash the cartridge with 10 mL of distilled water at the same flow rate. 4. Inject the sample. Use a small (1- or 2-mL) syringe to slowly inject 1 mL of the Kool-Aid® sample onto the column. Discard the column effluent (the portion that washed out as you injected the sample). 5. Elute the sample. Use a 10-mL syringe or a plastic dropper bottle to slowly elute the dyes. Fill the syringe or dropper bottle with the 18% isopropanol eluant, and pump at a steady rate of 5—10 mL per minute. Collect the effluent in a 10-mL graduated cylinder. Record the volume of effluent collected as the first and last of the colored drops of each of the dyes emerge. If there is not a perfect separation between the blue- and red-colored bands, record data for the beginning and end of the intermediate purple The center of the purple band will serve as the end of the first band and beginning of the last. 6. Regenerate the cartridge and repeat the measurements. Repeat the measurements two more times. Show all your data, and use the average values to make the calculations which are described below. Between injections, wash the column with 10 mL of distilled water Instrumentation Labs Name: __________________________________Page 15 of 17 at the same flow rate of 5—10 mL per minute. If colored material builds up on the column, repeat the pretreatment procedure. 7. Calculate the resolution, selectivity, and efficiency. Determine the following values. Show how each calculation is carried out and record your data in a table like the one shown below. The shaded sections do not need to be filled in. VR is retention volume. The retention volumes for the dyes in the experiment are the volumes corresponding to the centers of the red and blue bands. W is the band width, or the volume in mL of each dye as it emerges from the column. VRavg is the total volume eluted at the center of the band of each of the dyes. L is the column length. The cartridges in this experiment are 1.25 cm long. The column radius is r. These cartridges have a radius of 0.5 cm. VM is mobile phase volume. This represents about 50% of the total empty column volume and can be estimated as VM = 0.5 it r2 L. The value of VM will be in cm3 (mL) if r and L are measured in centimeters. k’ is the capacity factor. This is a unitless measure of the retention for each of the dyes, and can be calculated as k’ = (VR - VM) / VM. The optimum range for k’ is between 1 and 10. α is the selectivity or separation factor. It is the ratio of the separation of the k’ values: α = k’2 / k’1 where k’2 is the larger k’ value. For example, a value for a of 1.1 indicates that the column shows a 10% greater rententivity for the component that elutes second. Generally, a mobile phase is chosen which gives a value for a between 2 and 10. N represents the number of theoretical plates in the column. This can be considered as the number of times a solute is exchanged back and forth between the stationary and the mobile phase. The calculation is based on the dye which is eluted last. Generally, columns with a larger value for N are more efficient. In the small cartridges used, N should have a value between 20 and 200. R is the resolution. This represents the major goal of the experiment, the measure of how well the two components are separated by the column. R = (VRI - VR2) / ½ (W1 + W2). The numerator is the volume between bands. This is related to the selectivity. The denominator represents the average band width, which is proportional to the efficiency of the column. As resolution increases above a value of 1, there is much greater total separation of the dyes. Instrumentation Labs Name: __________________________________Page 16 of 17 Data Table (Place your cursor in the white boxes and type your answers.) Red Dye Blue Dye Experimental System VR (start) VR (end) W = VR (end) - VR (start) VRavg = VR (start) + ½ W L r VM = 0.5 Π r2 L k’ = (VRavg –VM)/VM α = k’2 / k’1 N = 16 (VR/W)2 R = (VR1 –VR2) / ½ (W1 + W2) Step Gradient Separation In this type of procedure, the composition of the eluting liquid is changed. Since the column first a very polar solvent, water, will be used. Then its composition will be changed to less polar more isopropanol. With this procedure we will be able to separate the citric acid and flavoring oils the dyes. 8. Prepare the Isopropanol eluants. Prepare the following concentrations of isopropanol in water by mixing the suggested amounts: 5% isopropanol in water: Mix 3.5 mL 70% isopropanol and 46.5 mL distilled water (or isopropanol and 47.2 mL distilled water). 28% isopropanol in water: Mix 20.0 mL 70% isopropanol and 30.0 mL distilled water 91% isopropanol and 34.5 mL distilled water). 9. Pretreat the cartridge. Follow the same procedure as in step 3. 10. Inject the sample and elute the components. Inject 1 mL of the grape drink. Elute the polar components of the mixture (citric acid and any sugar present) by passing 5 mL of water through the column. Collect the effluent in a small beaker. Next, elute the red dye by passing 5 to 10 mL of 6% isopropanol through the column. Note that large amounts of the 6% isopropanol can be used without eluting the blue dye. Collect this effluent in a second beaker. Thirdly, use the 28% isopropanol to elute the blue dye. Collect it in a third beaker. Lastly, use 8 mL of 70% isopropanol to elute the polar flavor oils and other nonpolar additives. Collect this fraction in a fourth beaker. 11. Evaporate the solvents and examine the components. Instrumentation Labs Name: __________________________________Page 17 of 17 Allow the four beakers of solution to evaporate by leaving them in the fume hood until the next laboratory period. Observe and describe the contents of each of the beakers. Disposal Solutions can be safely flushed down the sink. The cartridges can be discarded in the trash. Discussion (Place the cursor in the blank line below each question and type your answer. Email the file to me.) In your laboratory report include answers to the following questions: 1. What is meant by polarity of molecules? What causes differences in polarity? 2. In discussing solubility, the rule “like dissolves like” is frequently used. What does this mean? 3. Draw the structural formula of isopropanol. Explain how it differs in polarity from water. 4. For good separation of the dyes, the resolution should be greater than one. What was the value you calculated? Did the two dyes overlap as they emerged from the column, or was the separation a good one? 5. In the step gradient separation, four separate fractions were collected. How were these related to the polarities of the column and of the eluting solvent?

