HW #25 - Colorado Mesa University
advertisement
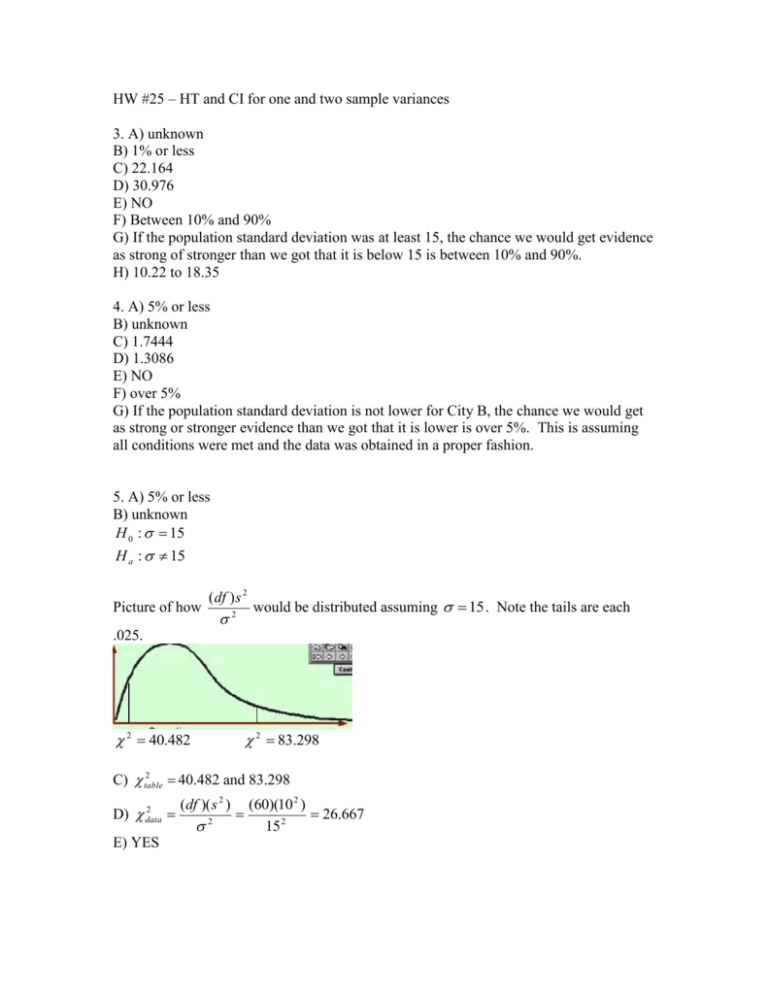
HW #25 – HT and CI for one and two sample variances 3. A) unknown B) 1% or less C) 22.164 D) 30.976 E) NO F) Between 10% and 90% G) If the population standard deviation was at least 15, the chance we would get evidence as strong of stronger than we got that it is below 15 is between 10% and 90%. H) 10.22 to 18.35 4. A) 5% or less B) unknown C) 1.7444 D) 1.3086 E) NO F) over 5% G) If the population standard deviation is not lower for City B, the chance we would get as strong or stronger evidence than we got that it is lower is over 5%. This is assuming all conditions were met and the data was obtained in a proper fashion. 5. A) 5% or less B) unknown H 0 : 15 H a : 15 Picture of how ( df ) s 2 2 would be distributed assuming 15 . Note the tails are each .025. 2 40.482 2 83.298 2 40.482 and 83.298 C) table 2 D) data E) YES (df )( s 2 ) 2 (60)(10 2 ) 26.667 15 2 F) The p-value is the area to the left of 26.667 doubled (since it is a two-tail test). The 26.667 is off the chi-square table so the tail area is less than .005, so the p-value is below .01 or 1%. G) If the population standard deviation was 15, the chance we would get evidence as strong of stronger than we got that it is not 15 is less than 1%. This is assuming all conditions were met and the data was obtained in a proper fashion. H) We use 2 (df )( s 2 ) 2 twice to get two values for 2 and then take the square root to get the population standard deviation. 40.428 (60)(10 2 ) 83.298 (60)(10 2 ) 2 2 8.49 to 12.17 6. A) unknown B) 10% or less (60)(10 2 ) 148.21 so 12.17 AND so 40.482 (60)(10 2 ) 72.03 so 8.49 so 2 83.298 2 A 1 (note the A went on the top since A’s sample standard B H 0 : A B or deviation is bigger) H a : A B or A 1 B s A2 Picture of how 2 would be distributed assuming A B . Note the tails are each .05. sB The df for the top is 60 and for the bottom is 120. Note that the WC stands for “who cares” since our Fdata will be bigger than 1 and therefore in the right tail. F60120 WC F60120 1.4290 C) WC(less than 1) and 1.4290 D) Fdata s A2 10 2 2 1.5625 s B2 8 E) YES F) All we can tell for the one page of the F-table we use is that the tail area is less than .05 and so the p-value is less than 10% (doubled since two-tail test). G) If the population variances are the same the chance we would get as strong or stronger evidence than we got that they differ is below 10%. This is assuming all conditions were met and the data was obtained in a proper fashion.

