2013 4th Quarter Economic Update
advertisement
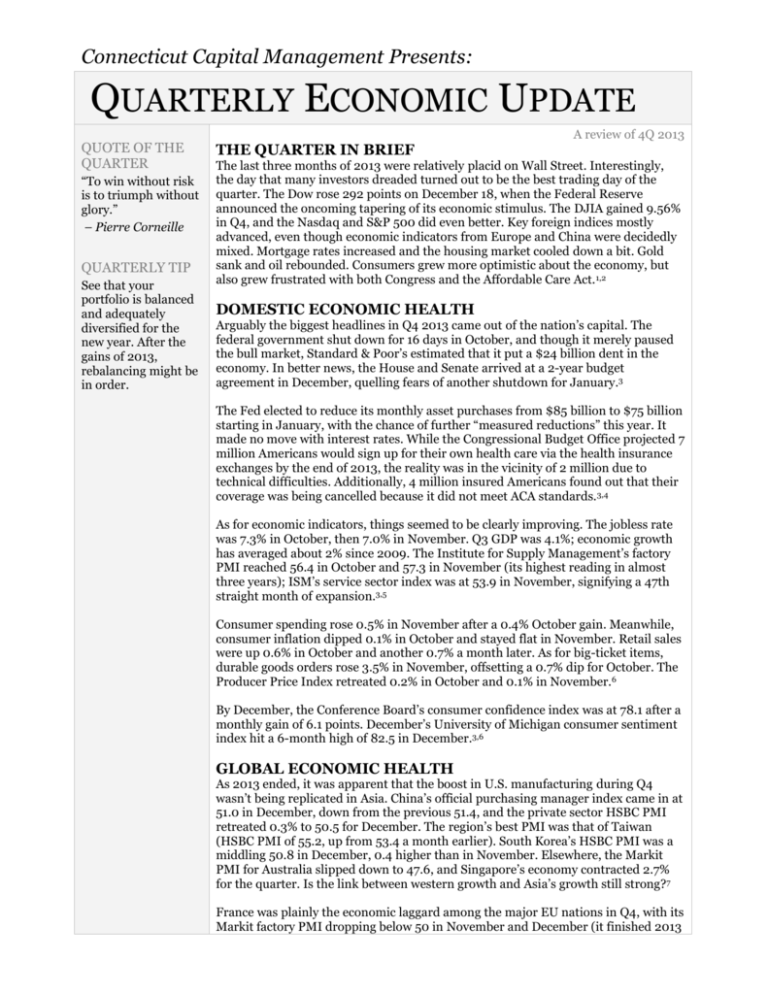
Connecticut Capital Management Presents: QUARTERLY ECONOMIC UPDATE QUOTE OF THE QUARTER “To win without risk is to triumph without glory.” – Pierre Corneille QUARTERLY TIP See that your portfolio is balanced and adequately diversified for the new year. After the gains of 2013, rebalancing might be in order. A review of 4Q 2013 THE QUARTER IN BRIEF The last three months of 2013 were relatively placid on Wall Street. Interestingly, the day that many investors dreaded turned out to be the best trading day of the quarter. The Dow rose 292 points on December 18, when the Federal Reserve announced the oncoming tapering of its economic stimulus. The DJIA gained 9.56% in Q4, and the Nasdaq and S&P 500 did even better. Key foreign indices mostly advanced, even though economic indicators from Europe and China were decidedly mixed. Mortgage rates increased and the housing market cooled down a bit. Gold sank and oil rebounded. Consumers grew more optimistic about the economy, but also grew frustrated with both Congress and the Affordable Care Act. 1,2 DOMESTIC ECONOMIC HEALTH Arguably the biggest headlines in Q4 2013 came out of the nation’s capital. The federal government shut down for 16 days in October, and though it merely paused the bull market, Standard & Poor’s estimated that it put a $24 billion dent in the economy. In better news, the House and Senate arrived at a 2-year budget agreement in December, quelling fears of another shutdown for January.3 The Fed elected to reduce its monthly asset purchases from $85 billion to $75 billion starting in January, with the chance of further “measured reductions” this year. It made no move with interest rates. While the Congressional Budget Office projected 7 million Americans would sign up for their own health care via the health insurance exchanges by the end of 2013, the reality was in the vicinity of 2 million due to technical difficulties. Additionally, 4 million insured Americans found out that their coverage was being cancelled because it did not meet ACA standards.3,4 As for economic indicators, things seemed to be clearly improving. The jobless rate was 7.3% in October, then 7.0% in November. Q3 GDP was 4.1%; economic growth has averaged about 2% since 2009. The Institute for Supply Management’s factory PMI reached 56.4 in October and 57.3 in November (its highest reading in almost three years); ISM’s service sector index was at 53.9 in November, signifying a 47th straight month of expansion.3,5 Consumer spending rose 0.5% in November after a 0.4% October gain. Meanwhile, consumer inflation dipped 0.1% in October and stayed flat in November. Retail sales were up 0.6% in October and another 0.7% a month later. As for big-ticket items, durable goods orders rose 3.5% in November, offsetting a 0.7% dip for October. The Producer Price Index retreated 0.2% in October and 0.1% in November.6 By December, the Conference Board’s consumer confidence index was at 78.1 after a monthly gain of 6.1 points. December’s University of Michigan consumer sentiment index hit a 6-month high of 82.5 in December.3,6 GLOBAL ECONOMIC HEALTH As 2013 ended, it was apparent that the boost in U.S. manufacturing during Q4 wasn’t being replicated in Asia. China’s official purchasing manager index came in at 51.0 in December, down from the previous 51.4, and the private sector HSBC PMI retreated 0.3% to 50.5 for December. The region’s best PMI was that of Taiwan (HSBC PMI of 55.2, up from 53.4 a month earlier). South Korea’s HSBC PMI was a middling 50.8 in December, 0.4 higher than in November. Elsewhere, the Markit PMI for Australia slipped down to 47.6, and Singapore’s economy contracted 2.7% for the quarter. Is the link between western growth and Asia’s growth still strong?7 France was plainly the economic laggard among the major EU nations in Q4, with its Markit factory PMI dropping below 50 in November and December (it finished 2013 at 47.0, a 7-month low). In contrast, the manufacturing PMI for the United Kingdom finished the year at 57.3 and came in at 58.1 in November. The quarter saw Spain’s factory PMI move back into the expansion zone (it was at 50.8 by December) and the euro area composite PMI finish the year at 52.7. Germany’s Markit PMI hit a 30month peak of 54.3 in December. The quarter saw the European Central Bank lower its benchmark interest rate 25 basis points to a record-low 0.25%. Annual eurozone inflation was just 0.9% in November compared to 2.2% a year earlier.7,8,9 WORLD MARKETS How did other benchmarks do in Q4? The aberration that is Venezuela’s Caracas General exchange aside (+52.49%), some of the best Q4 performers were Argentina’s MERVAL (+12.69%), Germany’s DAX (+11.14%), Pakistan’s KSE 100 (+15.70%) and Japan’s Nikkei 225 (+12.70%). Now for some of the worst performers: Thailand’s SET (-6.11%), Turkey’s BIST 100 (-8.97%) and the Philippines’ PSE Composite (-4.88%). Other notable indices: MSCI World, +7.61%; MSCI Emerging Markets, +1.54%; Global Dow, +7.56%; Asia Dow, +1.94%; Europe Dow, +7.05%; IPC All-Share, +6.33%; Kospi, +0.72%; Shanghai Composite, - 2.70%; Sensex, +9.24%; STOXX 600, +5.73%; CAC 40, +3.68%; FTSE 100, +4.44%; Bovespa, -1.59; TSX Composite, +6.52%.2,10 COMMODITIES MARKETS The big story here was the freefall for gold and silver. Gold prices dropped 9.4% in Q4 and 28.3% on the year to settle at $1,202.30 on December 31. Gold hadn’t had a down year since 2000. Silver did even worse: it lost 10.8% for Q4 and 35.9% for 2013. Platinum futures dipped 2.7% in Q4, finishing 2013 at -10.9%; only palladium posted an annual advance, going +2.1% despite a 1.2% loss in Q4. Copper ended up retreating 7.0% for 2013. The U.S. Dollar Index was little changed on the quarter, losing only 0.2%.11,12,13 The second biggest story in the commodities sector was the ascent of natural gas futures – for the year, they went +26.2%. NYMEX crude ended the quarter with a 7.5% annual gain. While Q4 gains sent cocoa futures to +21.2% for the year, other key crops suffered; 2013 losers included corn at -39.6%, coffee at -23.0%, soybeans at -7.5%, wheat at -22.2% and sugar at -15.9%.12 REAL ESTATE A comparison of Freddie Mac’s September 26 and December 26 Primary Mortgage Market Surveys shows an increase in interest rates for the two most common types of home loans. The September 26 averages: 30-year FRM, 4.32%; 15-year FRM, 3.37%; 5/1-year ARM, 3.07%; 1-year ARM, 2.63%. December 26 averages were as follows: 30-year FRMs, 4.48%; 15-year FRMs, 3.52%; 5/1-year ARMs, 3.00%; 1-year ARMs, 2.56%.14 As interest rates on conventional home loans increased, year-over-year existing home sales decreased. After declining in August and September, they fell 3.2% in October and 4.3% in November – and they were down year-over-year in November (-1.2%) for the first time in more than two years. Shrinking inventory was a major factor. Still, the National Association of Realtors reported a 9.4% annual gain in the median price of an existing home in November to $196,300, and a 0.2% advance in pending home sales after October’s 1.2% retreat. October’s S&P/Case-Shiller Home Price Index recorded an overall yearly gain of 13.6% in house prices.6,15 How about new construction? Well, October saw a 25.4% rise in new home purchases, followed up by a 2.1% decline in November; in November, new home prices had risen 10.6% in a year. Building permits were up 6.2% in October, down 3.1% in November; by November, the annual gain was 7.9%. Housing starts soared 22.7% in November, resulting in a 29.6% yearly increase.16,17 LOOKING BACK…LOOKING FORWARD The Dow, S&P 500 and Nasdaq all posted four consecutive monthly advances to close out 2013, finishing the year as follows: DJIA, 16,576.66; S&P, 1,848.36; NASDAQ, 4,176.59. The Russell 2000 wrapped up 2013 at 1,163.64, going +8.37% for Q4 and +37.00% for the year; the CBOE VIX fell 17.35% in Q4 and 23.86% for the year to settle at a mere 13.72 on December 31.2,18 % CHANGE 2013 4Q CHG 5-YR AVG 10-YR AVG DJIA +26.50 +9.56 +17.78 +5.86 NASDAQ +38.32 +10.74 +32.96 +10.85 S&P 500 +29.60 +9.92 +20.93 +6.62 12/31 RATE 1 YR AGO 5 YRS AGO 10 YRS AGO 0.80% -0.67% 2.14% 2.00% REAL YIELD 10 YR TIPS Sources: online.wsj.com, bigcharts.com, marketwatch.com, treasury.gov - 12/31/132,19,20,21 Indices are unmanaged, do not incur fees or expenses, and cannot be invested into directly. These returns do not include dividends. Last year was the best for the S&P 500 since 1997 (and the worst for the CBOE VIX since 2009). Could 2014 offer returns anywhere close to these? Almost no one thinks so. In the final 2013 Reuters poll of stock market analysts, the consensus forecast was for a 4.1% gain for the S&P 500 in 2014. This year might bring the end of QE3, and we might see a stock market correction; we haven’t had one in about two years, and historically they occur about once a year. There is plenty of good news to consider, however: consumer spending is improving, consumer confidence has increased, unemployment is lessening, the factory and service sectors are expanding, and the Fed’s decision to taper didn’t send interest rates through the roof. The average bull market lasts 3.8 years, and this one will turn five in March, yet Wall Street seems confident that the bulls can keep running even as the central bank winds down its asset purchases. If stocks gain 10% or better in 2014, that will be another one of this bull market’s numerous pleasant surprises.3,18 Registered Representative, Securities offered through Cambridge Investment Research, Inc., a Broker/Dealer, Member FINRA/SIPC. Cambridge and Connecticut Capital Management Group LLC are not affiliated. Investment Advisor Representative, Cambridge Investment Research Advisors, Inc., a Registered Investment Advisor This material was prepared by MarketingLibrary.Net Inc., and does not necessarily represent the views of the presenting party, nor their affiliates. Marketing Library.Net Inc. is not affiliated with any broker or brokerage firm that may be providing this information to you. This information should not be construed as investment, tax or legal advice and may not be relied on for the purpose of avoiding any Federal tax penalty. This is not a solicitation or recommendation to purchase or sell any investment or insurance product or service, and should not be relied upon as such. The Dow Jones Industrial Average is a price-weighted index of 30 actively traded blue-chip stocks. The NASDAQ Composite Index is an unmanaged, market-weighted index of all over-the-counter common stocks traded on the National Association of Securities Dealers Automated Quotation System. The Standard & Poor's 500 (S&P 500) is an unmanaged group of securities considered to be representative of the stock market in general. It is not possible to invest directly in an index. NYSE Group, Inc. (NYSE:NYX) operates two securities exchanges: the New York Stock Exchange (the “NYSE”) and NYSE Arca (formerly known as the Archipelago Exchange, or ArcaEx®, and the Pacific Exchange). NYSE Group is a leading provider of securities listing, trading and market data products and services. The New York Mercantile Exchange, Inc. (NYMEX) is the world's largest physical commodity futures exchange and the preeminent trading forum for energy and precious metals, with trading conducted through two divisions – the NYMEX Division, home to the energy, platinum, and palladium markets, and the COMEX Division, on which all other metals trade. The Caracas General Exchange is the only securities exchange operating in Venezuela. The price-weighted MERVAL Index (MERcado de VALores, literally Stock Exchange) is the most important index of the Buenos Aires Stock Exchange. The DAX 30 is a Blue Chip stock market index consisting of the 30 major German companies trading on the Frankfurt Stock Exchange. Karachi Stock Exchange 100 Index (KSE-100 Index) is a stock index acting as a benchmark to compare prices on the Karachi Stock Exchange (KSE) over a period. Nikkei 225 (Ticker: ^N225) is a stock market index for the Tokyo Stock Exchange (TSE). The Nikkei average is the most watched index of Asian stocks. The Stock Exchange of Thailand is the national stock exchange of Thailand. The Borsa Istanbul (BIST) is the sole exchange entity of Turkey. The main Philippines Stock Exchange index is the PSE Composite Index, which is composed of thirty (30) listed companies. The MSCI World Index is a free-float weighted equity index that includes developed world markets, and does not include emerging markets. The MSCI Emerging Markets Index is a float-adjusted market capitalization index consisting of indices in more than 25 emerging economies. The Global Dow (GDOW) is a 150-stock index of corporations from around the world, created by Dow Jones & Company. The Asia Dow is an equal-weighted, 30-stock index that measures 30 of the leading blue-chip stocks traded in the Asia/Pacific region. The Europe Dow measures the European equity markets by tracking 30 leading blue-chip companies in the region. The Mexican IPC index (Indice de Precios y Cotizaciones) is a capitalization-weighted index of the leading stocks traded on the Mexican Stock Exchange. The KOSPI Index is a capitalization-weighted index of all common shares on the Korean Stock Exchanges. The SSE Composite Index is an index of all stocks (A and B shares) that are traded at the Shanghai Stock Exchange. BSE Sensex or Bombay Stock Exchange Sensitivity Index is a value-weighted index composed of 30 stocks that started January 1, 1986. The Dow Jones STOXX 600 Index captures more than 90% of the aggregate market cap of European-based companies. The CAC-40 Index is a narrowbased, modified capitalization-weighted index of 40 companies listed on the Paris Bourse. The FTSE 100 Index is a share index of the 100 most highly capitalized companies listed on the London Stock Exchange. The Bovespa Index is a gross total return index weighted by traded volume & is comprised of the most liquid stocks traded on the Sao Paulo Stock Exchange. The S&P/TSX Composite Index is an index of the stock (equity) prices of the largest companies on the Toronto Stock Exchange (TSX) as measured by market capitalization. The US Dollar Index measures the performance of the U.S. dollar against a basket of six currencies. Additional risks are associated with international investing, such as currency fluctuations, political and economic instability and differences in accounting standards. This material represents an assessment of the market environment at a specific point in time and is not intended to be a forecast of future events, or a guarantee of future results. Past performance is no guarantee of future results. Investments will fluctuate and when redeemed may be worth more or less than when originally invested. All information is believed to be from reliable sources; however we make no representation as to its completeness or accuracy. All economic and performance data is historical and not indicative of future results. Market indices discussed are unmanaged. Investors cannot invest in unmanaged indices. The publisher is not engaged in rendering legal, accounting or other professional services. If assistance is needed, the reader is advised to engage the services of a competent professional. Citations. 1 - csmonitor.com/Business/Latest-News-Wires/2013/1218/After-Fed-tapers-stocks-hit-new-record [12/18/13] 2 - online.wsj.com/mdc/public/page/2_3022-quarterly_gblstkidx.html [12/31/13] 3 - dallasnews.com/business/business-headlines/20131231-aging-bull-may-still-have-more-room-to-run.ece [12/31/13] 4 - csmonitor.com/USA/DC-Decoder/Decoder-Wire/2013/1230/Obamacare-enrollment-surge-Mission-accomplished-or-misleading-blip [12/31/13] 5 - ism.ws/ISMReport/NonMfgROB.cfm [12/4/13] 6 - investing.com/economic-calendar/ [12/31/13] 7 - blogs.wsj.com/moneybeat/2014/01/02/macro-horizons-data-show-2013-ending-with-familiar-balance/ [1/2/14] 8 - nasdaq.com/article/european-stocks-turn-broadly-lower-after-pmi-reports-dax-down-053-cm315385 [1/2/14] 9 - economist.com/node/21592645/print [12/31/13] 10 - mscibarra.com/products/indices/international_equity_indices/gimi/stdindex/performance.html [12/31/13] 11 - coinnews.net/2013/12/31/gold-snaps-annual-winning-streak-silver-tumbles-in-2013/ [12/31/13] 12 - reuters.com/article/2013/12/31/markets-commodities-idUSL3N0KA0XL20131231 [12/31/13] 13 - online.wsj.com/mdc/public/npage/2_3050.html?mod=mdc_curr_dtabnk&symb=DXY [1/2/13] 14 - freddiemac.com/pmms/ [12/27/13] 15 - bloomberg.econoday.com/byshoweventfull.asp?fid=456315&cust=bloomberg-us&year=2013&lid=0&prev=/byweek.asp#top [12/19/13] 16 - bloomberg.econoday.com/byshoweventfull.asp?fid=456339&cust=bloomberg-us&year=2013&lid=0&prev=/byweek.asp [12/24/13] 17 - esa.doc.gov/economic-indicators/economic-indicators-6 [12/18/13] 18 - tinyurl.com/lnfj2gk [12/31/13] 19 - bigcharts.marketwatch.com/historical/default.asp?symb=DJIA&closeDate=12%2F31%2F08&x=0&y=0 [12/31/13] 19 - bigcharts.marketwatch.com/historical/default.asp?symb=COMP&closeDate=12%2F31%2F08&x=0&y=0 [12/31/13] 19 - bigcharts.marketwatch.com/historical/default.asp?symb=SPX&closeDate=12%2F31%2F08&x=0&y=0 [12/31/13] 19 - bigcharts.marketwatch.com/historical/default.asp?symb=COMP&closeDate=12%2F31%2F03&x=0&y=0 [12/31/13] 19 - bigcharts.marketwatch.com/historical/default.asp?symb=SPX&closeDate=12%2F31%2F03&x=0&y=0 [12/31/13] 20 - marketwatch.com/story/dow-closes-2003-strong-nasdaq-holds-2000 [12/31/13] 21 - treasury.gov/resource-center/data-chart-center/interest-rates/Pages/TextView.aspx?data=realyieldAll [1/3/14]
