The Graphs of other Trig Functions
advertisement
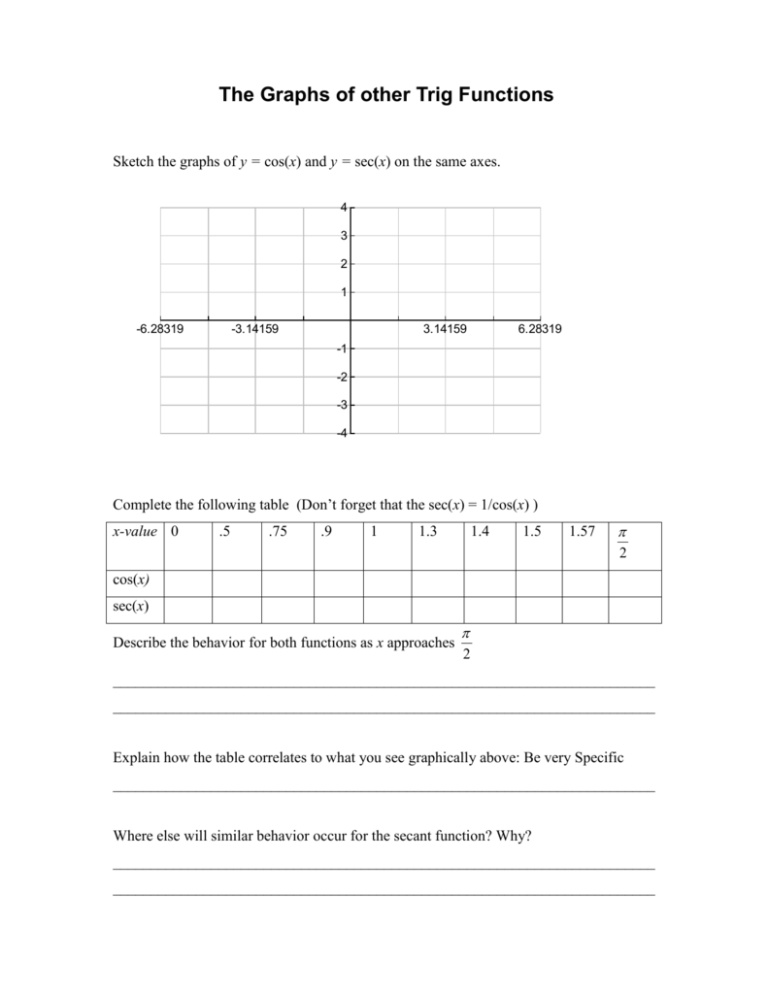
The Graphs of other Trig Functions Sketch the graphs of y = cos(x) and y = sec(x) on the same axes. 4 3 2 1 -6.28319 -3.14159 3.14159 6.28319 -1 -2 -3 -4 Complete the following table (Don’t forget that the sec(x) = 1/cos(x) ) x-value 0 .5 .75 .9 1 1.3 1.4 1.5 1.57 2 cos(x) sec(x) Describe the behavior for both functions as x approaches 2 ________________________________________________________________________ ________________________________________________________________________ Explain how the table correlates to what you see graphically above: Be very Specific ________________________________________________________________________ Where else will similar behavior occur for the secant function? Why? ________________________________________________________________________ ________________________________________________________________________ What is the period for y = sec(x)? ____________________________ Sketch the graphs of y = sin(x) and y = csc(x) on the same axes. 4 3 2 1 -6.28319 -4.71239 -3.14159 -1.5708 1.5708 3.14159 4.71239 6.28319 -1 -2 -3 -4 Complete the following table (Don’t forget that the csc(x) = 1/sin(x) ) x-value 0 .5 .75 .9 1 1.3 1.4 1.5 1.57 2 sin(x) csc(x) Describe the behavior for both functions as x approaches 2 ________________________________________________________________________ ________________________________________________________________________ Explain how the table correlates to what you see graphically above: Be very Specific ________________________________________________________________________ ________________________________________________________________________ Where else will similar behavior occur for the cosecant function? ________________________________________________________________________ ________________________________________________________________________ Graph y = csc(x + ) 4 4 3 2 1 -6.28319 -4.71239 -3.14159 -1.5708 1.5708 3.14159 4.71239 -1 -2 -3 -4 What do you suspect that the period of y = csc(2x) is? Verify graphically. 4 3 2 1 -6.28319 -4.71239 -3.14159 -1.5708 1.5708 -1 -2 -3 -4 Does this relate to what we did before? Explain. 3.14159 4.71239 6.28319 6.28319 Why is the study of trigonometric functions related to the study of rational functions? Find many comparisons. Write a summary concerning what you know concerning the graphs of trigonometric functions. Discuss the value of such an approach from an instructional point of view and course readings—two pages typed.


![[slides] Tomasulo's algorithm](http://s3.studylib.net/store/data/009667655_1-131b0456ada613df64c5c90f7e9e772c-300x300.png)