Bus
advertisement
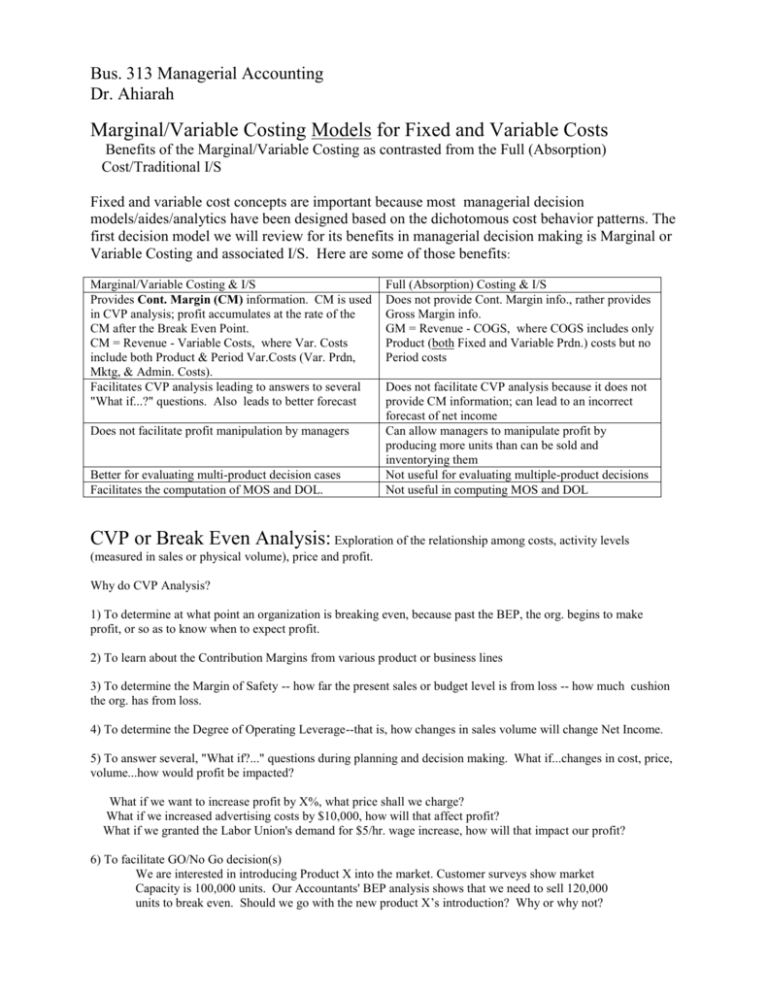
Bus. 313 Managerial Accounting Dr. Ahiarah Marginal/Variable Costing Models for Fixed and Variable Costs Benefits of the Marginal/Variable Costing as contrasted from the Full (Absorption) Cost/Traditional I/S Fixed and variable cost concepts are important because most managerial decision models/aides/analytics have been designed based on the dichotomous cost behavior patterns. The first decision model we will review for its benefits in managerial decision making is Marginal or Variable Costing and associated I/S. Here are some of those benefits: Marginal/Variable Costing & I/S Provides Cont. Margin (CM) information. CM is used in CVP analysis; profit accumulates at the rate of the CM after the Break Even Point. CM = Revenue - Variable Costs, where Var. Costs include both Product & Period Var.Costs (Var. Prdn, Mktg, & Admin. Costs). Facilitates CVP analysis leading to answers to several "What if...?" questions. Also leads to better forecast Does not facilitate profit manipulation by managers Better for evaluating multi-product decision cases Facilitates the computation of MOS and DOL. Full (Absorption) Costing & I/S Does not provide Cont. Margin info., rather provides Gross Margin info. GM = Revenue - COGS, where COGS includes only Product (both Fixed and Variable Prdn.) costs but no Period costs Does not facilitate CVP analysis because it does not provide CM information; can lead to an incorrect forecast of net income Can allow managers to manipulate profit by producing more units than can be sold and inventorying them Not useful for evaluating multiple-product decisions Not useful in computing MOS and DOL CVP or Break Even Analysis: Exploration of the relationship among costs, activity levels (measured in sales or physical volume), price and profit. Why do CVP Analysis? 1) To determine at what point an organization is breaking even, because past the BEP, the org. begins to make profit, or so as to know when to expect profit. 2) To learn about the Contribution Margins from various product or business lines 3) To determine the Margin of Safety -- how far the present sales or budget level is from loss -- how much cushion the org. has from loss. 4) To determine the Degree of Operating Leverage--that is, how changes in sales volume will change Net Income. 5) To answer several, "What if?..." questions during planning and decision making. What if...changes in cost, price, volume...how would profit be impacted? What if we want to increase profit by X%, what price shall we charge? What if we increased advertising costs by $10,000, how will that affect profit? What if we granted the Labor Union's demand for $5/hr. wage increase, how will that impact our profit? 6) To facilitate GO/No Go decision(s) We are interested in introducing Product X into the market. Customer surveys show market Capacity is 100,000 units. Our Accountants' BEP analysis shows that we need to sell 120,000 units to break even. Should we go with the new product X’s introduction? Why or why not? 7) To facilitate control of operations. Which product(s)/business(es) contribute most/least to profit, and which managers should receive extra reward or more coaching or even warning? Manager A Candies $100 75 25 25% 12.2% Product Type Sales Variable Cost Contribution Margin Dept. Cont. Margin % Mgr. CM% to Total CM Manager B Greeting Cards $120 80 40 33.33% 19.5% Manager C Photo Process $140 100 40 28.57% 19.5% Manager D Periodicals $200 100 100 50% 48.78% Gen. Mgr Total $560 325 205 36.61% 100% * Assumptions in CVP Analysis * Graphical approach to CVP * Equation/mathematical approach to CVP: Based on the Profit Equation or the Marginal I/S equation: SP(x) - VC(x) - TFC = Profit Single Product scenario $ales and Units to earn a target profit Units formula: TFC/$CM per unit; $Sales formula: TFC/CM%; where CM% = CM ratio Units to earn a Target (EBIT) profit: (TFC + TP)/$CM per unit; $Sales to earn a Target (EBIT) Profit: (TFC + TP)/CM% Units to earn X % Return on Sales: TFC/(SCM per unit + ROS per unit) $Sales to earn X % Return on Sales: TFC/(CM% - X% ROS) * Margin of Safety * BEP in Multiple Product cases (You will need Sales-Mix percentages and Cont. Margin percentages), where Sales Mix is a term used to describe the composition of a firm's sales or the constituent make-up of its total sales. It is the proportional breakdown of a firm's total sales from its major product or service offerings). C-V-P FORMULAS Single Product Multiple Product Unit Sales to achieve BEP $Dollar Sales to achieve BEP Unit Sales to earn a Target Profit (TP) $Dollar Sales to earn a Target Profit (TP) Unit Sales to earn a Target Profit (TP) after taxes $Dollar Sales to earn a Target Profit (TP) after taxes Unit Sales to earn X% Return on Sales $ales dollar to earn X ROS TFC/$CM per unit TFC/Average $CM per unit TFC/CM% TFC/Average CM% (TFC+TP)/$CM per unit (TFC+TP)/Average $CM per unit (TFC+TP)/CM% (TFC+TP)/Average CM% (TFC+[NI/1-Tax Rate])/$CM per unit (TFC+[NI/1-Tax Rate])/Average $CM per unit (TFC+[NI/1-Tax Rate])/CM% (TFC+[NI/1-Tax Rate])/Average CM% TFC/($CM per unit – X%ROS per unit) TFC/(CM%-X%ROS)
