ENVS 355 Final Exam
advertisement
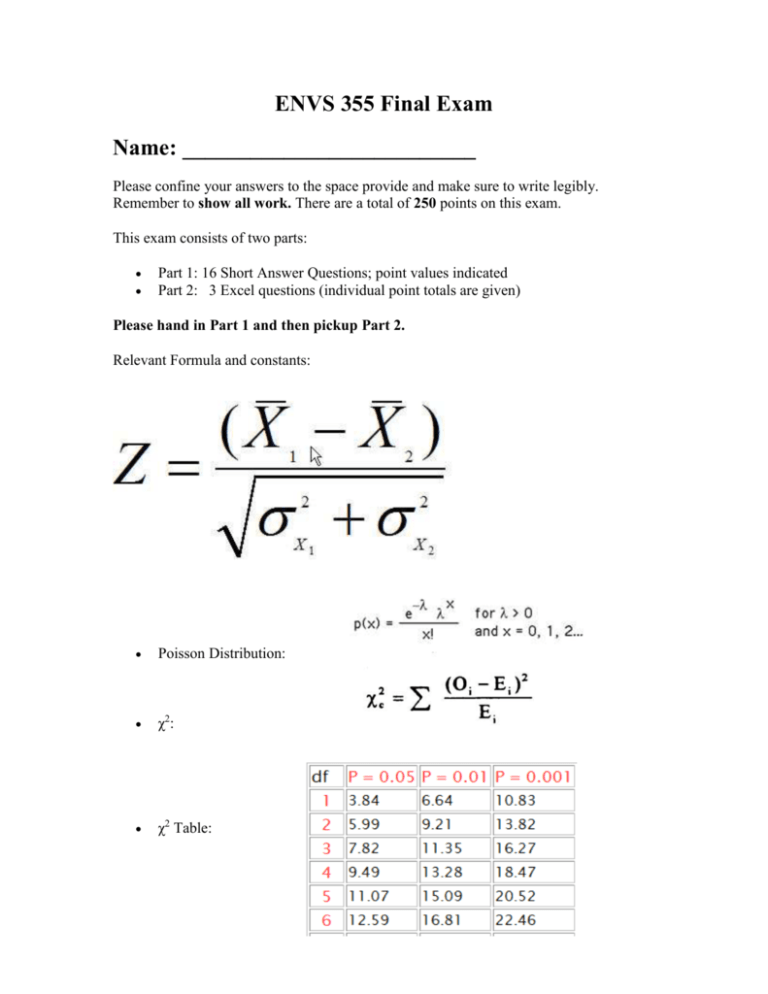
ENVS 355 Final Exam Name: __________________________ Please confine your answers to the space provide and make sure to write legibly. Remember to show all work. There are a total of 250 points on this exam. This exam consists of two parts: Part 1: 16 Short Answer Questions; point values indicated Part 2: 3 Excel questions (individual point totals are given) Please hand in Part 1 and then pickup Part 2. Relevant Formula and constants: Poisson Distribution: χ2: χ2 Table: Each Question in this Section is worth 10 points: (100 points total) 1. I wish to give 2% of my class and A+ on a midterm exam but I also want those students to get more than 95% on the midterm exam. My exam has an average score of 73%. What must the standard deviation on my exam be in order to meet my goals? 2. Stephanie, an expert sailor, is able to sail a specific course with an average time of 18 +/- 1 minute based on N=16 trials. Big Moo, a complete novice, sailed the same specific course, but due to sea sickness problems, was only able to complete N=4 trials. His average time was 23 +/- 4 minutes. Is Stephanie a significantly better sailor than Big Moo? 3. On average, 3 dead Zardhogs appear every 2 miles of Texas highway. What is the probability that a Zardhog cleaning crew will have to process 4 dead Zardhogs in 1 mile of Texas Highway? 4. The Zinderland News (ZNN) has just released a story where Zindertists (a.k.a. Zinderland scientists) have reprogrammed the ZNA of Zinderbites so that Zindernoodles can grow faster. Since everyone in Zinderland understands regression, the ZNN story merely said: Growth = (3.0 +/- 0.5) * Zbites + 2; σ =0.8 Using Zbites = 10, calculate the 95% confidence levels on value of Growth using all of the known errors. 5. You dropped your jar of sacred marbles and wanted to make sure that you didn't loose any. When you picked them up and counted them there were 202. A note taped to the jar says there are 225 marbles in this jar. Is your count of 202 consistent with 225? (show your reasoning). 6. Explain how the concept of predator "handling time" acts as a feedback helps insure that the addition of more predators doesn’t necessarily cause the prey density to rapidly collapse. 7. Why is kernel smoothing a superior alternative to the moving average method when the data has some underlying long timescale fluctuations? 8. Why does water vapor act as the principle greenhouse gas on Planet Earth. 9. Explain how media coverage of the BP oil spill revealed our various levels of scientific illiteracy. 10. Explain why climate indexing is a good method for detecting regional climate change. Each question in this section is worth 15 points (90 points total) 11. Explain how the Dmax statistic is derived in the KS test and why the KS test is such a powerful statistical test when comparing one distribution with another. 12. Physically explain how the presence of a planetary atmosphere leads to a "greenhouse" effect 13. Explain why, in the longer run (e.g. greater than 100 years) methane is likely to be the dominant greenhouse gas in the Earth's atmosphere 14. Explain why the adult survival probability is the critical parameter that determines λ (the growth rate of mammalian populations 15. Draw the H vs P diagram and show the DH/DP vectors as a function of quadrant. Explain why this model predicts a density dependent lag time between predator and prey abundance. Which reaches (predator or prey) their peak density first and why? 16. In calculating the effects of habitat loss on a species, three critical variables are used: p, h and k. Explain what each of these are and how these variables are best obtained. Part 2: For this part, all you need to do is to type the exam URL into the file/open dialogue box in Excel. That will download the data needed for the following 3 questions. Write in basic answers below, when necessary. Exam URL: http://homework.uoregon.edu/pub/class/355/final10.xls Before doing anything else, save that final exam excel file to your desktop using yourlastname as the filename.! When finished email your excel spreadsheet to: uohomework@gmail.com 17. (25 points). There are 20 x,y pairs given. In excel do the following steps: a) run the regression and predict the value of Y at X = 25 b) Explicitly calculate the chi^2 sum c) Identify any points in the original data set that have deviations that are more than +/- 1.8 standard deviations from the regression. Eliminate those and re do the regression and again predict the value of Y at X=25.. Calculate the chi^2 sum of for this new regression. 18. (15 points) Global warming data are given in columns B and C and a graph of that data is shown. Using the moving average method, with a window size of 11, operate on the data and produce a new graph in place of the current one. 19. (20 points) Time series data is given for the average weekly price of a barrel of Crude Oil: a) produce a graph of that data and qualitatively describe its features/behavior b) Through any means necessary, predict the price of crude oil in the Summer of 2012 based on this data.

