上海第二医科大学仁济临床医学院
advertisement
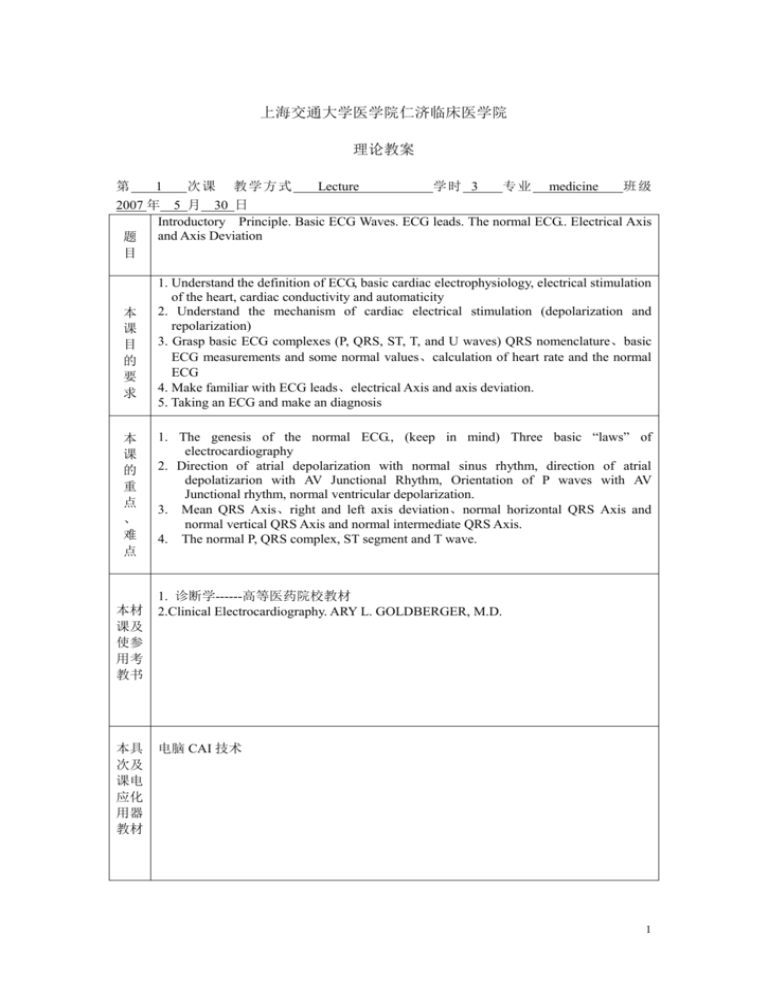
上海交通大学医学院仁济临床医学院 理论教案 第 1 次 课 教 学方 式 Lecture 学时 3 专 业 medicine 班级 2007 年 5 月 30 日 Introductory Principle. Basic ECG Waves. ECG leads. The normal ECG.. Electrical Axis and Axis Deviation 题 目 本 课 目 的 要 求 本 课 的 重 点 、 难 点 本材 课及 使参 用考 教书 本具 次及 课电 应化 用器 教材 1. Understand the definition of ECG, basic cardiac electrophysiology, electrical stimulation of the heart, cardiac conductivity and automaticity 2. Understand the mechanism of cardiac electrical stimulation (depolarization and repolarization) 3. Grasp basic ECG complexes (P, QRS, ST, T, and U waves) QRS nomenclature、basic ECG measurements and some normal values、calculation of heart rate and the normal ECG 4. Make familiar with ECG leads、electrical Axis and axis deviation. 5. Taking an ECG and make an diagnosis 1. The genesis of the normal ECG., (keep in mind) Three basic “laws” of electrocardiography 2. Direction of atrial depolarization with normal sinus rhythm, direction of atrial depolatizarion with AV Junctional Rhythm, Orientation of P waves with AV Junctional rhythm, normal ventricular depolarization. 3. Mean QRS Axis、right and left axis deviation、normal horizontal QRS Axis and normal vertical QRS Axis and normal intermediate QRS Axis. 4. The normal P, QRS complex, ST segment and T wave. 1. 诊断学------高等医药院校教材 2.Clinical Electrocardiography. ARY L. GOLDBERGER, M.D. 电脑 CAI 技术 1 教学程序、时间分配及主要内容 备注 Basic Principles and Patterns Basic ECG Waves (ECG Leads-twelve leads) The six extremity leads record voltages from the heart directed onto the frontal plane of the body.(this divides the body into front and back halves.) A bipolar lead (I II III ) records the difference between voltages from the heart detected at two extremities. A unipolar ( aVR aVL aVF) lead records voltages at one point relative to zero potential. The bipolar extremity leads can be represented by Einthoven’s triangle. They are related by the equation II =I+III. The unipolar extremity leads can be represented by a triaxial diagram. They are related by the equation aVR+aVL+aVF=0. The three unipolar extremity leads and the three bipolar extrimity leads can be shown on the same diagram, so the axes of all six leads intersect at a common point, producing the hexaxial lead diagram. As a rule, the P-QRS-T pattern in lead I resembles that in lead aVL, leads aVR and II usually show reverse patterns. Lead aVF usually resembles lead III. Six chest leads record voltages from the heart directed onto the horizontal plane of the body(which divides the body into an upper and a lower half). The chest leads are taken with electrodes in specific anatomic locations. The normal ECG (1) The three basic “laws” of ECG are as follows: 1. A positive(upward)deflection will be seen in any lead if depolarization spreads toward the poaitive pole of that lead. 2. A negative(downward)deflection will be seen if depolarization spreads toward the negative pole(or away) from the positive pole) of any lead. 3. If the mean depolarization path is directed at right angles(perpendicular) to any lead, a small biphasic(RS or QR)deflection will be seen. Atrial depolarization starts in the sinus node and spreads downward and to the left, toward lead II and away from lead aVR. Therefore, with normal sinus thythm, the p wave is always positive in lead II and negative in lead aVR. 2 The normal ECG (2) Ventricular depolarization consists of two sequential phases: 1. The first phase of ventricular depolarization is stimulation of the ventricular septum from left to right. This produces a small(septal)r wave in the right chest leads and a small(septal)q wave in left chest leads. 2. During the second major phase of ventricular depolarization, the stimulus spreads simultaneously outward through the right and left ventricles. Since the mass of the normal left ventricle overbalances the mass of the right ventricle, the spread of depolarization through the left ventricle predominates on the normal ECG. This sptrad of stimulus through the sleft ventricle produces a tall R wave in the left chest leads(such as V5 and V6) (in association with a small q wave initial r wave) Chest leads between these extreme positions show a transitional pattern with tall R waves and deep S waves. The normal ECG (3) In the extremity leads the shape of the QRS complex varies with the electrical position of the heart: 1. When the heart is electrically horizontal, leads I and aVL show a qR pattern. 2. When the heart is electrically vertical, leads II,III and aVF show a qR pattern. The normal T wave generally follows the direction of the main deflection of the QRS complex in any lead. In the chest leads the T wave may normally be negative in leads V1 and V2. In most adults the T wave becomes positive by lead V2 and remains positive in the left chest leads. In the extremity leads the T wave is always positive in lead II and negative in aVR. When the heart is electrically horizontal, the QRS complex and T wave are positive in leads I and aVL. When the heart is electrically vertical, the QRS complex and T wave are positive in leads II, III, and aVF. Electrical Axis and Axis Deviation (1) 3 The approximate mean QRS axis can be determined by using one of the following rules: 1. The mean QRS axis will be pointed midway between any two leads that show tall R waves of equal height. 2. The mean QRS axis will be pointed at right angles (perpendicular) to any lead showing a biphasic complex and toward other leads showing tall R waves. The normal mean QRS axis lies between –300 and +1000. An axis more negative than –300 is defined as left axis deviation (LAD). An axis more positive than +1000 is defined as right axis deviation (RAD). LAD is an extreme form of a “horizontal” electrical axis. RAD is an extreme form of a “vertical” electrical axis. LAD can be readily recognized if lead II shows an RS complex in which the S wave is deeper than the R wave is tall. In addition, lead I will show a tall R wave and lead III a deep S wave. LAD can be seen in cases of left ventricular hypertrophy, left anterior hemiblock, and other pathologic conditions and is sometimes seen in normal people. Electrical Axis and Axis Deviation (2) RAD is present if the R wave in lead III is taller than the R wave in lead II. In addition, lead I will show an rS complex. RAD can be seen in several conditions, including right ventricular hypertrophy, lateral wall myocardial infarction, chronic lung disease, and left posterior hemiblock, and sometimes in normal people. In rarer cases the QRS will be biphasic in all six extremity leads, making the mean electrical axis indeterminate. The mean electrical axis of the P wave and T wave can also be estimated in the same manner as the mean QRS axis. With normal sinus rhythm the normal P wave will be about +600 (positive P wave in lead II). Normally the T wave axis in the frontal plane will be similar to the QRS axis, so the T waves will normally be positive in leads with a predominantly positive QRS complex. Normal ECG value Standardization mark. The ECG needs to be standardized only before the first lead is recorded. PR interval. The PR interval is measured from the beginning of the P wave to the beginning of the QRS complex. The normal PR interval varies from 0.12 to 0.2 second. QRS width. The normal QRS width is 0.1 second or less . R/S <1 in V1. R/S >1 in V5. RV5 < 2.5 mv. SV1+RV5 < 4mv. RV1+SV5 < 1.2mv. RavR < 0.5mv. RavL < 1.2 mv. R avF < 2 mv. Q wave amplitude < ¼ R wave in the lead and < 0.04 second in width T wave < 1/10 R in the lead and following the direction of the mean QRS deflection. QT interval. The QT interval is measured from the beginning of the QRS complex to the end of the T wave. It varies with the heart rate, becoming shorter as the heart rate increases 4 Heart rate The heart rate can be calculated in two ways: Method 1. Count the number of large (0.2 sec) time boxes between two successive R waves and divide the constant, 300, by this number. If you want a more accurate measurement of the rate,divide the constant, 1500, by the number of small (0.04 sec) time boxes between two successive R waves. Method 2. Count the number of cardiac cycles that occur every 6 seconds and multiply this number by 10. A vertical mark appears on the top of the ECG paper every 3 seconds. A cardiac cycle is the interval between two successive R waves. A heart rate slower than 60 beats/min is called bradycardia; a heart rate faster than 100 beats/min is called tachycardia. 小 结 要 点 及 复 习 思 考 题 撰 写 人 1. Basic Principles and Patterns 2. Basic ECG Waves (ECG Leads-twelve leads) 3. The normal ECG 4. Electrical Axis and Axis Deviation 5. Normal ECG value 陈颖明 诊断学 教研室 2007.4 撰写日期 5

