Is This a Bubble
advertisement
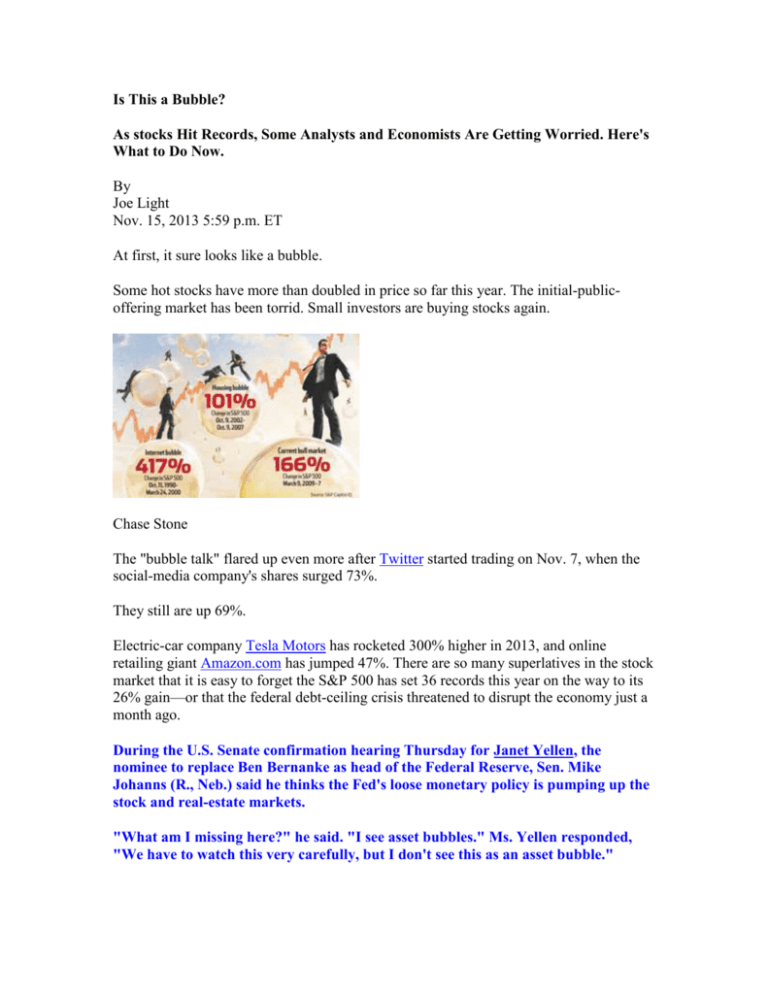
Is This a Bubble? As stocks Hit Records, Some Analysts and Economists Are Getting Worried. Here's What to Do Now. By Joe Light Nov. 15, 2013 5:59 p.m. ET At first, it sure looks like a bubble. Some hot stocks have more than doubled in price so far this year. The initial-publicoffering market has been torrid. Small investors are buying stocks again. Chase Stone The "bubble talk" flared up even more after Twitter started trading on Nov. 7, when the social-media company's shares surged 73%. They still are up 69%. Electric-car company Tesla Motors has rocketed 300% higher in 2013, and online retailing giant Amazon.com has jumped 47%. There are so many superlatives in the stock market that it is easy to forget the S&P 500 has set 36 records this year on the way to its 26% gain—or that the federal debt-ceiling crisis threatened to disrupt the economy just a month ago. During the U.S. Senate confirmation hearing Thursday for Janet Yellen, the nominee to replace Ben Bernanke as head of the Federal Reserve, Sen. Mike Johanns (R., Neb.) said he thinks the Fed's loose monetary policy is pumping up the stock and real-estate markets. "What am I missing here?" he said. "I see asset bubbles." Ms. Yellen responded, "We have to watch this very carefully, but I don't see this as an asset bubble." Others agree. "I'm frankly a little floored that so many people are asking about a bubble," says Liz Ann Sonders, chief investment strategist at Charles Schwab, which has more than $2 trillion in client assets. "Maybe because we've had two ferocious bubbles recently, we're more in tune with the possibility." Hulbert on Investing A Return to Internet Mania? Taking a closer look, it seems investors this time are more selectively exuberant. David T. Friendly, a 57-year-old movie producer in Los Angeles, tried to buy Twitter stock at its IPO price but couldn't find a broker who could get him any shares. After the company's first-day pop, he says he is going to wait for a pullback to buy. He says he remains wary of the stock market as a whole. "It's too stressful. Too much 'up, down, up, down,'" he says. Before the financial crisis, Mr. Friendly says he allocated between 30% and 40% of his portfolio to stocks. Now he keeps only 20% in the market. "I sleep a lot better at night," he says. The World's Cheapest and Most Expensive Stock Markets The bubble skeptics include Yale University economist Robert Shiller, who won a Nobel Prize in economics in October and has a successful track record of identifying speculative excess in asset prices. His book "Irrational Exuberance," published at the peak of the dot-com mania, accurately predicted a stock-market collapse. His 2005 update to the book then correctly identified the housing market as being in a speculative boom. Looking at stocks today, Mr. Shiller puts it this way: "The market is somewhat high, but it's not a time when I would be writing 'Irrational Exuberance.'" His preferred measure of valuing stocks indicates that stocks are merely expensive, rather than bubbly. Investors frequently measure stocks' value by dividing their prices by historical or projected company earnings. To smooth out cyclical peaks and troughs in those earnings, Mr. Shiller divides the S&P 500 by the average of the last 10 years' earnings for the index's components after adjusting both for inflation. By that measure, the S&P 500 has a price/earnings ratio of about 24.5, some 48% higher than the 16.5 average for U.S. stocks since 1881. That might sound high. But before the housing bubble popped, the P/E approached 28—and as the dot-com bubble peaked, the P/E ratio reached 44. Even though stocks aren't in a bubble, they still are high-priced, Mr. Shiller says. And many analysts and economists, including Mr. Shiller, think small investors could do well to find the places in the market where prices don't look so frothy. With that in mind, here's a guide to the last vestiges of "cheap" in stocks and what investors need to look out for. Still Pricey Even though stocks look expensive, there are many reasons to think this bull could continue. The bottom line: Investors shouldn't flee the market now simply because they think a pullback is due, but they should get ready in case the market goes much higher from here. For one, small investors have only just returned to the market. This year through October, investors have put $111 billion into U.S. stock mutual funds and exchange-traded funds, according to research firm Morningstar. That doesn't yet make up for the $134 billion they have taken out of stocks since 2009. In the four years leading up to the tech bubble's peak in 2000, investors put $471 billion into U.S. stock funds, according to Morningstar. Even though the Shiller P/E looks high, on other measures stocks don't look nearly as pricey. For example, the S&P 500's P/E based on the last 12 months of earnings is 15.8 versus an average of 16.9 since 1999, according to FactSet. It might feel like this run-up has lasted for ages, but it isn't really all that out of the ordinary for bull markets, says Sam Stovall, chief equity strategist at S&P Capital IQ. (Bull markets are defined as a 20% rise without an ensuing 20% pullback, based on closing prices.) So far, the rise that started on March 9, 2009, has lasted 56 months and produced gains of 166%. Of the 16 other bull markets since 1921, six have been longer and five have risen more. Mr. Stovall worries that the market could be due for a correction—defined as a pullback of 10% to 20%—but notes that the S&P 500 simply isn't in a range that sounds alarm bells. On top of that, though interest rates have risen, bonds still are near historically high prices, making them a poor place to hide cash. Bond prices move in the opposite direction of interest rates. Cliff Asness, the founding and managing principal of AQR Capital Management in Greenwich, Conn., which oversees about $90 billion, says his firm was moderately bullish on stocks at the beginning of the year but now is "dead neutral." Mr. Asness says that he thinks a typical portfolio of 60% stocks and 40% bonds is likely to rise about 2.5% annually over the next decade after inflation, compared with a typical historical return of about twice that. Auto maker Tesla Motors' stock has risen 300% so far this year. Getty Images An analysis of long-term data run for The Wall Street Journal by Mr. Shiller finds that when markets start at a cyclically adjusted P/E of 24.5, they have tended to return about 2.5% annually after inflation over the next 10 years. With a low return expected from stocks and bonds, investors preparing for retirement will have to save more to make up the difference. For example, with an annual return of 5%, an investor could save $2,500 a month and end up with a $1 million portfolio after 20 years. With a 2.5% return, the same investor would need to save about $3,250 a month to reach the same $1 million target. Investors should prepare to trim their U.S. stock allocations if the S&P 500 rises another 15% or more, says Ben Inker, co-head of asset allocation at money manager GMO in Boston, which oversees about $110 billion. If stocks were 15% more expensive than they are today while earnings remained unchanged, Mr. Shiller's analysis shows, they would be expected to return less than 1% a year after inflation over the next decade. That is almost the same as what investors could earn in inflation-protected Treasurys, which carry much less risk. "We don't have any particular reason to believe the stock market is going down this week, this month or into next year," Mr. Inker says. "We just think the U.S. stock market is a lousy risk-reward trade-off right now." Other Options Saving more money is the only guaranteed way to increase a nest egg faster, but there are other ways to improve an investor's chances of a higher return. First, even though U.S. stocks look expensive, there are sectors within the country—and entire regions outside the U.S.—that look cheap. Take Europe. Deflation fears and continuing worries about fiscal problems in Greece and other Southern European countries have battered stocks, making markets there the cheapest they have been in a very long time, says Meb Faber, chief investment officer at Cambria Investment Management in Los Angeles, which oversees $260 million. Applying Mr. Shiller's P/E ratio to other countries, Mr. Faber finds that as of Oct. 31, Greece traded at a P/E of only 4. Ireland, Italy, Portugal and Spain—which round out the set of euro-zone countries with troubled debt—all had P/E ratios of 10 or less. Even Germany, while not facing economic troubles nearly as severe as those other countries, traded at a Shiller P/E of 15.6. Emerging-market countries, such as China, Taiwan and Mexico, also trade at Shiller P/Es below that of the U.S. "Most of the world is pretty cheap. It's the U.S. that's the exception," Mr. Faber says. Of course, investors shouldn't put all their eggs in one basket by betting on the cheapest country. Instead, the best option might be a broad-market index fund that invests abroad. For developed markets, options include the iShares MSCI EAFE ETF, which has annual fees of 0.34%, or $34 per $10,000 invested, or the Vanguard FTSE Developed Markets ETF, which costs 0.1%. In the emerging world, the Vanguard FTSE Emerging Markets ETF and the iShares Core MSCI Emerging Markets ETF both cost 0.18%. Certain sectors within the U.S. also look cheap, Mr. Shiller notes. He finds the cheapest sectors to be energy, consumer staples, health care and industrials, based on his P/E calculations. State Street offers ETFs that target specific sectors, such as the Energy Select Sector SPDR, or the Health Care Select Sector SPDR, which both have annual fees of 0.18%. AQR's Mr. Asness also suggests that investors try to improve their performance in other ways, such as with so-called value stocks, which have low prices relative to their earnings or net assets, or strategies such as arbitrage or momentum. Some firms, such as AQR, run funds that use such strategies. Investors can also cheaply tilt toward value stocks with ETFs such as the Vanguard Value ETF, which costs 0.1%. At the same time, investors should stay away from the hot "bubblets" that have appeared over the past year, says Mark Yusko, chief investment officer at Morgan Creek Capital Management in Chapel Hill, N.C., which manages $6.8 billion. He notes that Amazon now trades at a P/E based on 12-month trailing earnings of more than 1,000. "I don't think there's ever been a company where, if I paid 1,000 times earnings, then it's done well 10 years out," Mr. Yusko says. "It might do well 10 weeks out or even 10 months out, but as an investor, you have to preserve wealth first and grow wealth second." Write to Joe Light at joe.light@wsj.com

