F = ma Cart Lab
advertisement
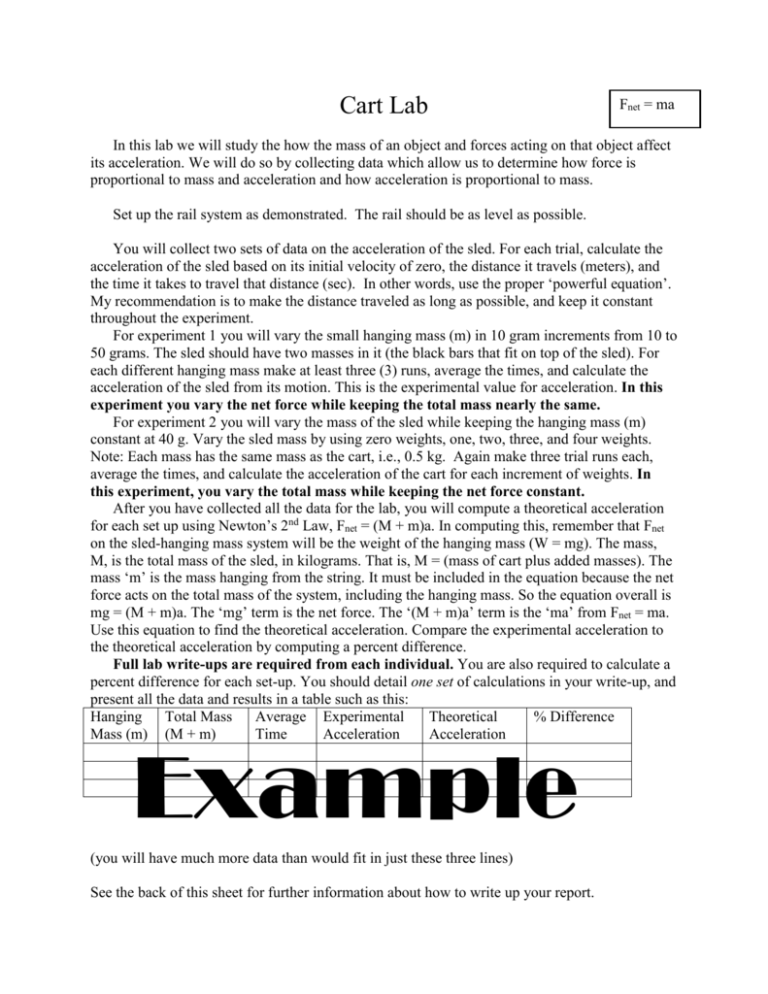
Cart Lab Fnet = ma In this lab we will study the how the mass of an object and forces acting on that object affect its acceleration. We will do so by collecting data which allow us to determine how force is proportional to mass and acceleration and how acceleration is proportional to mass. Set up the rail system as demonstrated. The rail should be as level as possible. You will collect two sets of data on the acceleration of the sled. For each trial, calculate the acceleration of the sled based on its initial velocity of zero, the distance it travels (meters), and the time it takes to travel that distance (sec). In other words, use the proper ‘powerful equation’. My recommendation is to make the distance traveled as long as possible, and keep it constant throughout the experiment. For experiment 1 you will vary the small hanging mass (m) in 10 gram increments from 10 to 50 grams. The sled should have two masses in it (the black bars that fit on top of the sled). For each different hanging mass make at least three (3) runs, average the times, and calculate the acceleration of the sled from its motion. This is the experimental value for acceleration. In this experiment you vary the net force while keeping the total mass nearly the same. For experiment 2 you will vary the mass of the sled while keeping the hanging mass (m) constant at 40 g. Vary the sled mass by using zero weights, one, two, three, and four weights. Note: Each mass has the same mass as the cart, i.e., 0.5 kg. Again make three trial runs each, average the times, and calculate the acceleration of the cart for each increment of weights. In this experiment, you vary the total mass while keeping the net force constant. After you have collected all the data for the lab, you will compute a theoretical acceleration for each set up using Newton’s 2nd Law, Fnet = (M + m)a. In computing this, remember that Fnet on the sled-hanging mass system will be the weight of the hanging mass (W = mg). The mass, M, is the total mass of the sled, in kilograms. That is, M = (mass of cart plus added masses). The mass ‘m’ is the mass hanging from the string. It must be included in the equation because the net force acts on the total mass of the system, including the hanging mass. So the equation overall is mg = (M + m)a. The ‘mg’ term is the net force. The ‘(M + m)a’ term is the ‘ma’ from Fnet = ma. Use this equation to find the theoretical acceleration. Compare the experimental acceleration to the theoretical acceleration by computing a percent difference. Full lab write-ups are required from each individual. You are also required to calculate a percent difference for each set-up. You should detail one set of calculations in your write-up, and present all the data and results in a table such as this: Hanging Total Mass Average Experimental Theoretical % Difference Mass (m) (M + m) Time Acceleration Acceleration Example (you will have much more data than would fit in just these three lines) See the back of this sheet for further information about how to write up your report. Using graph paper provided by your teacher, make three graphs by hand: 1. Acceleration (a in m/s2) (y-axis) vs. Force (F in N) (x-axis) for experiment 1. 2. Acceleration (a in m/s2) (y-axis) vs. Total Mass (M + m in kg) (x-axis) for experiment 2. 3. Acceleration (a in m/s2) (y-axis) vs. the Inverse of Total Mass (1/(M + m) in 1/kg) (xaxis) (using the same experiment 2 data that you used to make graph 2). Questions to answer about your graphs: 1. What mathematical form does the graph most resemble (think back to graphing functions in algebra)? For each graph, write a separate answer. 2. For the linear graphs, what is the value of the slope based on a line of best fit? (Draw a best-fit line and compute the slope using two points on the line you drew). 3. What are the units of the slope for each line you drew? 4. A direct proportion shows a graph with a straight line. The slope is a constant which when multiplied by one number, gives another directly proportional to it. An inverse proportion shows a graph that looks like the function y = 1/x. Which of your graphs shows a direct proportion and which show an inverse proportion? 5. For the graphs showing a direct proportion, what is the value of the constant with units? What physical meaning does this constant have in physical terms based on your experimental method? 6. Write an equation for each graph using the variables from your experiment instead of x and y. For example, in the first graph replace y with a and x with F. 7. The second and third graphs make the same point in different ways. What two variables (F, m, or a) are inversely proportional? How does the third graph confirm your conclusion? Remember, many functions look superficially like y = 1/x. For example, y = 1/x2 looks very similar. 8. Look carefully at the equation F = ma. All three variables are proportional to the other two. 1. How is F proportional to m? 2. How is F proportional to a? 3. How is m proportional to a? Use your data, graphs, and the answers to the questions above to support your assertions. Consider rearranging the equation as follows: y = mx a = (1/m)(F) a = (F)(1/m) or am = F Exp 1 Exp 2 Which variable has been made into a constant (the slope)? Which variables are changing? Remember that a newton (N), the SI unit of force, is defined as 1 N = 1 kg·m/s2.

