Exercise 2
advertisement
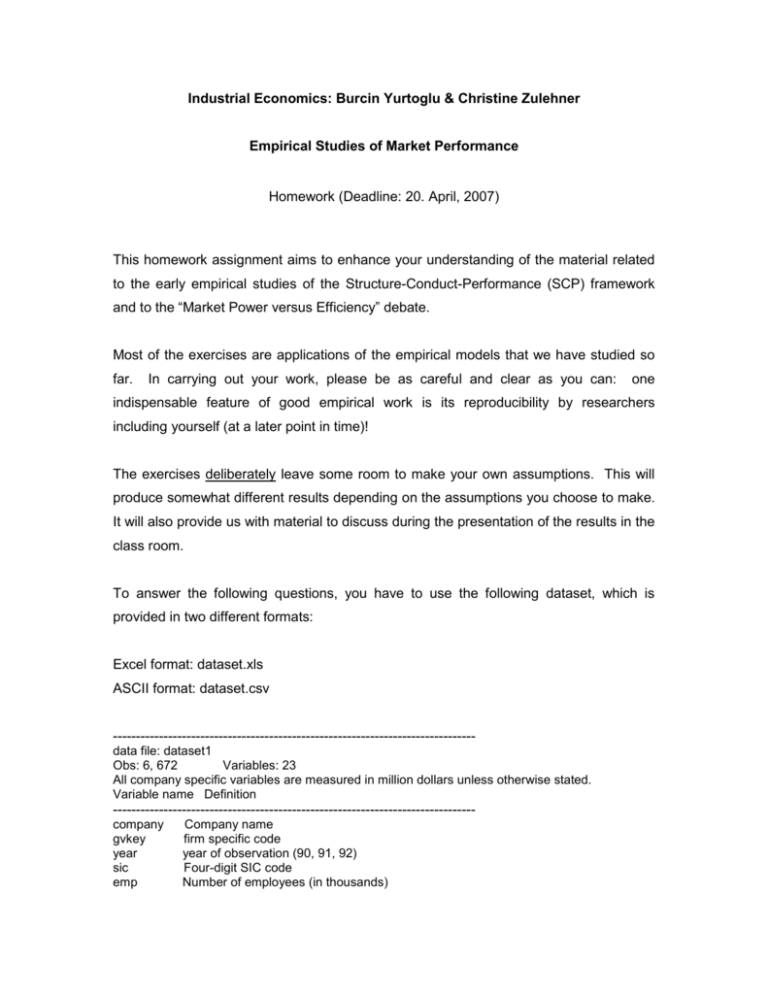
Industrial Economics: Burcin Yurtoglu & Christine Zulehner Empirical Studies of Market Performance Homework (Deadline: 20. April, 2007) This homework assignment aims to enhance your understanding of the material related to the early empirical studies of the Structure-Conduct-Performance (SCP) framework and to the “Market Power versus Efficiency” debate. Most of the exercises are applications of the empirical models that we have studied so far. In carrying out your work, please be as careful and clear as you can: one indispensable feature of good empirical work is its reproducibility by researchers including yourself (at a later point in time)! The exercises deliberately leave some room to make your own assumptions. This will produce somewhat different results depending on the assumptions you choose to make. It will also provide us with material to discuss during the presentation of the results in the class room. To answer the following questions, you have to use the following dataset, which is provided in two different formats: Excel format: dataset.xls ASCII format: dataset.csv ------------------------------------------------------------------------------data file: dataset1 Obs: 6, 672 Variables: 23 All company specific variables are measured in million dollars unless otherwise stated. Variable name Definition ------------------------------------------------------------------------------company gvkey year sic emp Company name firm specific code year of observation (90, 91, 92) Four-digit SIC code Number of employees (in thousands) ppent at sale ib xrd xint xadr1 irs_adv cr4_92 cr8_92 cr20_92 cr50_92 hhi_92 Property, plant and equipment net total assets total sales income before extraordinary items R&D expenses interest expense four-digit Advertising to sales ratios* 2-digit Advertising to sales ratios derived from IRS reports (1991) Four-firm concentration ratio (1992) Eight-firm concentration ratio (1992) Twenty-firm concentration ratio (1992) Fifty-firm concentration ratio (1992) Herfindahl index (1992) cr4_87 cr8_87 cr20_87 cr50_87 hhi_87 Four-firm concentration ratio (1987) Eight-firm concentration ratio (1987) Twenty-firm concentration ratio (1987) Fifty-firm concentration ratio (1987) Herfindahl index (1987) ----------------------------------------------------------------------------------*: xadr1 is taken from Rogers, Richard T. and Tokle, Robert J. Advertising Expenditures in U.S. Manufacturing Industries: 1967 and 1982, Working paper, Northeast Regional Research Project 165, 1993. Please note that this is a firm-level panel dataset, i.e., the units (firms) are observed in years 1992, 1993, 1994 and 1995. The various concentration ratios are specific to the four-digit SIC industries. The SIC classification is provided in a separate text file (SIC.txt) Exercise 1 Consider one of the earliest SCP studies by Bain (1951). See also Martin (2002, pp. 121-129). a) What is the measure of profitability used by Bain (1951)? The dataset allows you to construct Bain’s preferred measure of profitability. Produce descriptive statistics on the return on sales and return on assets as well as on other variables of potential interest. b) Try to replicate the basic results of Bain (1951). These are given in Table 5.2 of Martin (2002, p. 125). c) Which relevant variables are omitted from these equations and what does Bain do in a later study (Bain, 1956) to overcome this shortcoming? Exercise 2 The Excel dataset “dataset2.xls” includes the following variables: year, q, y, pchick, pbeef, pcor, pf, cpi, qproda, pop, meatex, and time. y: real disposable income per head pchick: price of chicken pbeef: price of beef pcor: preis of corn pf: price of chicken feed cpi: Consumer price index qproda: aggregate production of chicken meat (in pounds) pop: Population of the USA meatex: Exports of beef, pork and veal Estimate the following equation: ln_qc = a1 + a2*ln_pc + u where, ln_qc=log(qproda) und ln_pc=log(pchick) a) Interpret this equation. b) Are there any missing variables in this specification, which theoretically belong to a demand equation? Which variables and why? c) Is the simultaneity of price and quantity a problem? How can one solve this problem? d) What role should the variables CPI and POP play? e) Determine an estimate for he following • Own price elasticity of demand for chicken meat. • Cross price elasticity between beef and chicken meet. • Income elasticity of demand. 4

