David Pollard
advertisement
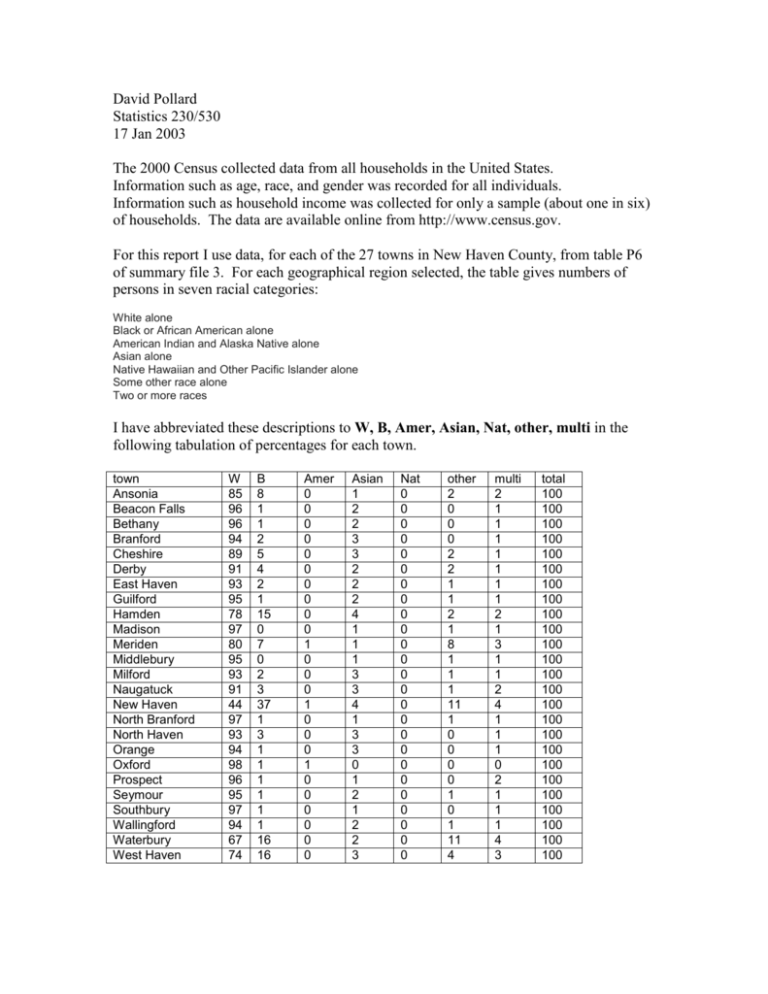
David Pollard Statistics 230/530 17 Jan 2003 The 2000 Census collected data from all households in the United States. Information such as age, race, and gender was recorded for all individuals. Information such as household income was collected for only a sample (about one in six) of households. The data are available online from http://www.census.gov. For this report I use data, for each of the 27 towns in New Haven County, from table P6 of summary file 3. For each geographical region selected, the table gives numbers of persons in seven racial categories: White alone Black or African American alone American Indian and Alaska Native alone Asian alone Native Hawaiian and Other Pacific Islander alone Some other race alone Two or more races I have abbreviated these descriptions to W, B, Amer, Asian, Nat, other, multi in the following tabulation of percentages for each town. town Ansonia Beacon Falls Bethany Branford Cheshire Derby East Haven Guilford Hamden Madison Meriden Middlebury Milford Naugatuck New Haven North Branford North Haven Orange Oxford Prospect Seymour Southbury Wallingford Waterbury West Haven W 85 96 96 94 89 91 93 95 78 97 80 95 93 91 44 97 93 94 98 96 95 97 94 67 74 B 8 1 1 2 5 4 2 1 15 0 7 0 2 3 37 1 3 1 1 1 1 1 1 16 16 Amer 0 0 0 0 0 0 0 0 0 0 1 0 0 0 1 0 0 0 1 0 0 0 0 0 0 Asian 1 2 2 3 3 2 2 2 4 1 1 1 3 3 4 1 3 3 0 1 2 1 2 2 3 Nat 0 0 0 0 0 0 0 0 0 0 0 0 0 0 0 0 0 0 0 0 0 0 0 0 0 other 2 0 0 0 2 2 1 1 2 1 8 1 1 1 11 1 0 0 0 0 1 0 1 11 4 multi 2 1 1 1 1 1 1 1 2 1 3 1 1 2 4 1 1 1 0 2 1 1 1 4 3 total 100 100 100 100 100 100 100 100 100 100 100 100 100 100 100 100 100 100 100 100 100 100 100 100 100 Now make some wise observations. Maybe comment on the towns that have high percentages of black population. (How do they compare with state or national averages?) Questions. Is the table a good way to convey racial differences across towns? Would some sort of plot be better? Would more decimal places help or hinder? Is the “total” column needed? Would it help to have a final row showing the percentages for the whole county? Would it help to have some indication of total population size for each town? What are those big numbers in the “other” column? Explanation needed. Why are there no Hispanics? Why don’t the rows actually sum to 100%? How could I check that I haven’t made a blunder somewhere? For example, I might have mixed up the column headings, or I might have selected the wrong table.


