“noise equivalent acceleration” is the “sensitivity” of the system, ie
advertisement

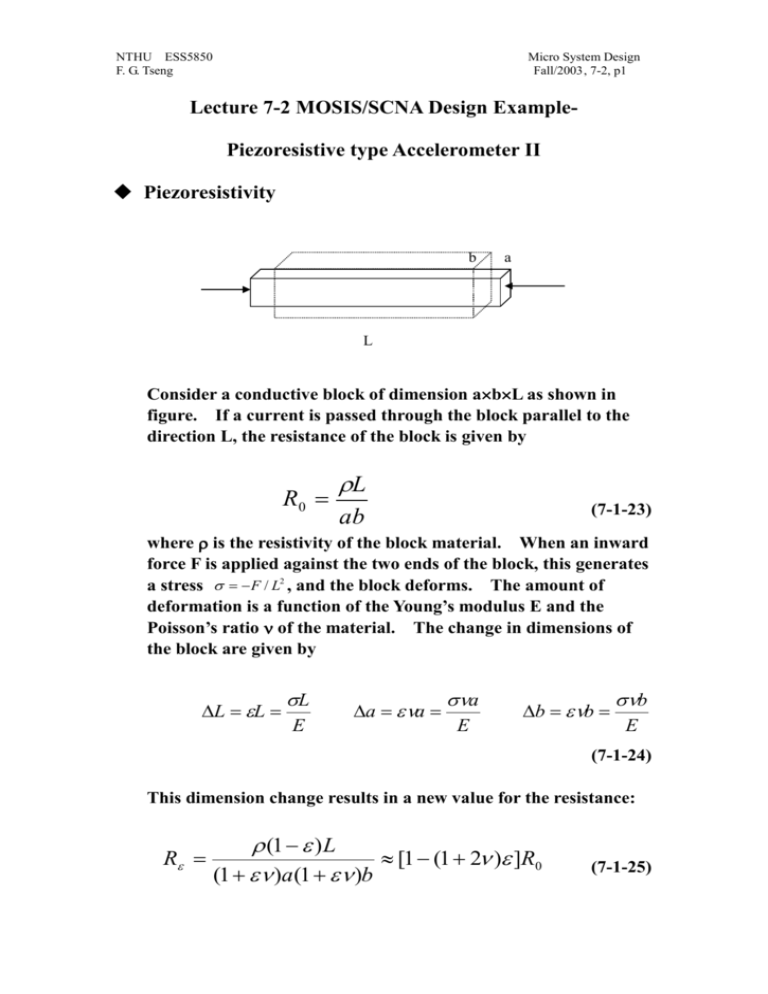
NTHU ESS5850 F. G. Tseng Micro System Design Fall/2003, 7-2, p1 Lecture 7-2 MOSIS/SCNA Design ExamplePiezoresistive type Accelerometer II Piezoresistivity b a L Consider a conductive block of dimension abL as shown in figure. If a current is passed through the block parallel to the direction L, the resistance of the block is given by R0 L (7-1-23) ab where is the resistivity of the block material. When an inward force F is applied against the two ends of the block, this generates a stress F / L2 , and the block deforms. The amount of deformation is a function of the Young’s modulus E and the Poisson’s ratio of the material. The change in dimensions of the block are given by L L L E a a a E b b b E (7-1-24) This dimension change results in a new value for the resistance: R (1 ) L [1 (1 2 ) ]R0 (1 )a(1 )b (7-1-25) NTHU ESS5850 F. G. Tseng Micro System Design Fall/2003, 7-2, p2 The gage factor Ggauge is defined to be the change in resistance per change in strain: Gguage R / R0 (7-1-26) The gauge factor from Eqn. (7-1-25) is G=1+2. The Poisson’s ratio for most materials is roughly 0.3, giving a typical gauge factor for most conductors of Ggauge 1.6. e.g. a 1% strain will result in a 1.6% change in resistance. In addition to this shape-based change in resistance, some materials exhibit a substantial change in resistance due to a strain-induced change in the resistivity of the material. This is known as the piezoresistive effect, and is particularly apparent in silicon crystals, where the gauge factor due to piezoresistivity can be as large as 200 in magnitude. The gauge factors of n-type and p-type silicon have opposite sign, with n-type being negative. Due to a variety of effects, the gauge factor of polysilicon films is typically an order of magnitude lower than single crystal films, with typical values of 20 to 30 for p-type silicon, and –15 to –25 for n-type. The average strain for finite length of piezoresistive material sitting on top of the beam, extending a length Lg from the base of the beam. The strain varies linearly along the beam, and is zero at the tip and maximum at the base, so the average stain in the piezoresistor is given by: ave (1 Lg 2L ) max (7-1-27) Combining Eqn. 7-1-22, 26, 27, we can have L 3 ya R Ggauge(1 g ) R 2 L 2 L2 (7-1-28) NTHU ESS5850 F. G. Tseng Micro System Design Fall/2003, 7-2, p3 Maximum deflection From Eqn. 7-1-14, the deflection of a cantilever beam: M 0 x2 1 Fx 2 y ( x) [ (3L x) ] EI 6 2 where F and M are the force and moment applied to the beam. In the above case, F=ma, and M=FLp/2 2 3 2 3 Lb Lp MLb 1 FLb F Lb y ( Lb ) [ ] [ ] EI 3 2 EI 3 4 (7-1-29) The tip of the proof mass deflects an additional amount determined by the angle of the tip of the support beam (assume the proof mass is a rigid body without any deflection under the acceleration force) F L2b L p Lb ( Lb ) [ ] EI 2 2 (7-1-30) The deflection of the tip of the proof mass is y ( Lb L p ) y ( Lb ) ( Lb ) L p (7-1-31) Resonant frequency From the analysis of the dynamic of the beam, the natural frequency is NTHU ESS5850 F. G. Tseng Micro System Design Fall/2003, 7-2, p4 Ea 3 b 4 L3b K m WL p t n (7-1-32) Responsivity Re sponsivity output signal input physical quantity Raccelerometer output Voltage input acceleration Ve R+R R V+ V- R+R R From the above Wheatstone bridge V V V R R R R R Ve Ve Ve Ve 2 R R 2 R R 2 R R 2R (7-1-33) NTHU ESS5850 F. G. Tseng Micro System Design Fall/2003, 7-2, p5 From Eqn. (7-1-26) Lg R G gauge G gauge (1 ) max R 2L Lg zM max G gauge (1 ) 2 L EI Lp Lg z[( maace )( 2 Lb )] G gauge (1 ) a 3b 2L E( ) 12 (7-1-34) Combine Eqns. 7-1-33 and 34, we can have Racce Lg V 6VeGgauge(1 ) aace 2 Lb Racce 3VeGgauge z (tWLp )( Lp 2 Ea b Lb ) 3 z 2 ( tWL p) 3 Ea b (7-1-34) Noise There are several sources of noise in this device. 1. Johnson Noise: The resistors in the Wheatstone bridge each contribute noise power of 4kT per Hertz of bandwidth. Johnson noise comes from thermal agitation of electrons within a resistance, and it sets a lower limit on the noise present in a circuit. The corresponding effective voltage noise is related to power by the NTHU ESS5850 F. G. Tseng Micro System Design Fall/2003, 7-2, p6 usual relationship: Power = v n2 / R , or vn 4kTRf (7-1-35) where f is the bandwidth of interest. Johnson noise is also referred to as thermal noise, resistance noise or white noise. It is independent of the composition of the resistance, and the frequency distribution of thermal noise power is uniform. The instantaneous amplitude for thermal noise has a Gaussian, or normal, distribution. The average is zero and the RMS value is given above. The thermal noise generated by any arbitrary connection of passive elements is equal to the thermal noise that would be generated by a resistance equal to the real part of the equivalent network impedance. 2. TNEA (Thermal noise-equivalent acceleration): The spring/mass system of the cantilever contributes its own noise to the system, with a noise power of kT/2 in each mode of vibration. This leads to an effective RMS deflection of 1 1 Kx n2 kT 2 2 (7-1-36) which yields an equivalent RMS acceleration of an 4kT 0 MQ (7-1-37) NTHU ESS5850 F. G. Tseng Micro System Design Fall/2003, 7-2, p7 where 0 is the nature frequency, M is the mass, K is the spring constant, and Q 0 M c is the quality factor of the spring system. k is Boltzmann’s constant (1.38e-23 joules/K). Sensitivity In order to compare the relative importance of these noise sources, it is useful to move them from their source to some common location in the signal block diagram. Typically this is the input to the electronic amplifier, or the real input (such as acceleration). In this way we can really compare the effects from different noise sources. For example, we can move all above noises to the input, by which we can have them as “noise equivalent acceleration”. Here the “noise equivalent acceleration” is the “sensitivity” of the system, i.e., the minimum input signal we can detect. Dynamic range 1. Upper limit: Strain limits For most of the micro-mechanical materials, the fracture strain is roughly 1%. We need to transfer the strain limit into equivalent acceleration. From Eqn. 7-1-20 NTHU ESS5850 F. G. Tseng Micro System Design Fall/2003, 7-2, p8 zM EI Lp z[( maupper )( Lb )] 2 a 3b E( ) 12 frac (0, z ) aupper a3b E( ) a 12 (0, ) L 2 a [( m)( p Lb )] 2 2 (7-1-38) 2. Lower limit: Sensitivity Here is the “noise equivalent acceleration”. Temperature dependency TCR (Temperature Coefficient of Resistance) 1. Metal: 0[1 (T T0 )] Material Aluminum Copper Nickel Platinum Gold Resistivity: 10-8 m 2.65 1.678 6.8 10.42 2.24 Table adopted from J. Fraden[1]. TCR: (10-3 K) 3.9 3.9 6.9 3.7 3.4 NTHU ESS5850 F. G. Tseng 2. Silicon: very sensitivity to purity Micro System Design Fall/2003, 7-2, p9 NTHU ESS5850 F. G. Tseng Micro System Design Fall/2003, 7-2, p10 2. How to compensate temp. effect? a. Cancel out through reference or symmetry design. b. Feedback control through adjustable gain from temp sensor c. Software adjustment Long term stability 1. Operation Lifetime? 2. On shelf life? 3. Long-term drift? Reference: 1. Jacob Fraden, “AIP Handbook of Modern sensors, Physics, Designs and Applications”, American Institute of Physics, 1993. 2. Henry W. Ott, “Noise Reduction Techniques in Electronic Systems”, second edition, John Wiley & Sons, Inc., 1988. 3. James M. Gere and Stephen P. Timoshenko, “Mechanics of Materials”, fourth edition, PWS publishing company, 1997. 4. Semiconductor Sensors, S.M. Sze, Wiley Inter. Science, 1994.


