Graph Traversal Applet
advertisement
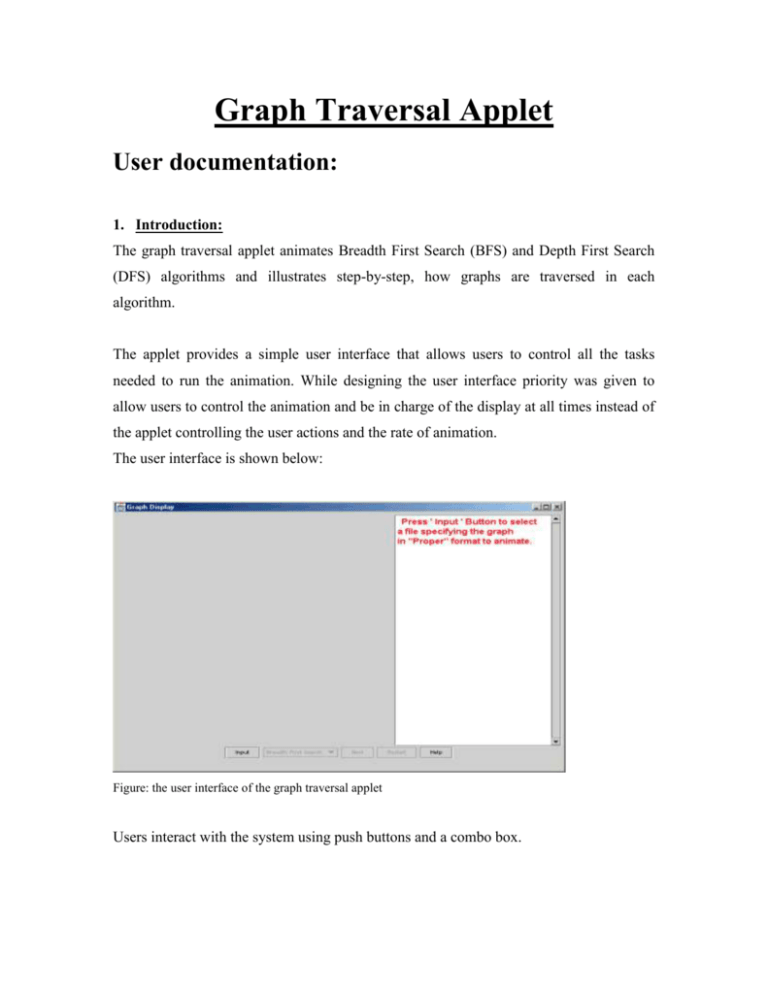
Graph Traversal Applet User documentation: 1. Introduction: The graph traversal applet animates Breadth First Search (BFS) and Depth First Search (DFS) algorithms and illustrates step-by-step, how graphs are traversed in each algorithm. The applet provides a simple user interface that allows users to control all the tasks needed to run the animation. While designing the user interface priority was given to allow users to control the animation and be in charge of the display at all times instead of the applet controlling the user actions and the rate of animation. The user interface is shown below: Figure: the user interface of the graph traversal applet Users interact with the system using push buttons and a combo box. The controls provided are: a) Input: This button is used to select a file that specifies the graph users intend to animate. While performing the animation, a new graph can be selected and animated simply by selecting a new file, using the input button. b) Combo box: This allows users to select one of the algorithms (BFS or DFS) to animate. c) Next: This is the main button controlling the algorithm animation and allows users to go to the next step in the algorithm. The speed of the animation depends on its use. d) Restart: This button allows users to restart the animation of the current graph. Users need to use this button to change the starting node or the algorithm that is to be animated. e) Help: This button explains to users the interface of the system in brief. User feedback is given, using the graph display and the text field provided next to it. The graph display highlights the starting node, the current active node, the nodes in queue/stack depending on the algorithm selected, the visited and the unvisited nodes, the current edge being traversed from the current active node to the other node, the traversed and the un-traversed edges. Besides this, the graph displays at the bottom, depending on the algorithm selected, a stack or a queue, to show insertion and deletion and the order of nodes in it. Information regarding the nodes and edges is also displayed in the text field, which explains the current stage of the algorithm in detail. A detailed description of the tasks that a user needs to perform and the applet animation is given below. 2. Applet Animation and User Tasks: When a user starts the animation system the text display, as shown below, instructs the user to select a file that has the graph description by clicking on the ‘Input’ button. Figure: The initial interface when the user starts running the applet. Clicking the ‘Input’ button pops up a file dialog box from where the user can select the file to animate. Figure: File dialog box to select the file to read the graph. The applet reads the selected file and displays the graph in the display area as shown in the next figure. Figure: Shows the graph display, read from the file selected. The text field displays the textual feedback. The graph display as shown above is divided into two parts. The top part shows the graph animation and the bottom part shows the animation of the queue/stack depending on the algorithm selected. The queue/stack is initially empty. The default algorithm selected by the system is BFS. The user can change the algorithm to DFS by selecting the Depth First Search algorithm from the Combo box provided. For both BFS and DFS algorithms, a starting node needs to be specified from where the graph traversal begins. The user can select the starting node by clicking on one of the graph nodes. The node that has been selected is shown pink in color. Figure: The starting node is highlighted in pink. When the user starts the animation by clicking on the ‘Next’ button, the Combo box that allows the user to select the algorithm to animate is disabled. This prevents the user from changing the algorithm once the animation begins. The start node for the graph traversal also cannot be changed once the user starts the animation. The user can step through the algorithm by pressing the ‘Next’ button repeatedly. Figure: The edges traversed are shown in pink, those in BFS tree are shown in dark pink, others in light pink, untraversed edges are shown in grey. The nodes visited are in pink, the starting node in dark pink, current node in dark green and node currently in Queue is highlighted light green. Different color combinations have been used to show different stages of the graph traversal. By default, at the start of the animation, an un-traversed graph is always shown in gray. The start node that has been previously selected is shown in dark pink. As the animation proceeds, all the nodes that are in Queue/Stack are shown in light green color and the current active node is shown in dark green. The nodes that are in the queue/stack are displayed in the queue/stack box at the bottom of the screen. The current active edge being traversed from the current active node to the other node is also shown in dark green. All traversed edges can have either dark pink or light pink color depending on whether they belong to the BFS/DFS tree or not. The edges that are in the tree are shown in dark pink where as all the edges that have been traversed but do not belong to the tree are shown in light pink color. Besides visualization, each step of the algorithm is also explained with textual feedback in the text field on the right side of the screen. In addition to the instructions in the text area and the feedback messages, the user can also refer to the help manual if there is any confusion with the interface and the graphical display The help manual is displayed when the help button is clicked. Figure: Shows the help file. As shown in the figure below, once the algorithm is traced through, Figure: Shows a traversed graph, BFS tree is highlighted in dark pink. the nodes that are visited are shown in pink with the starting node in dark pink. All the traversed edges are in pink with the BFS/DFS tree highlighted. The unvisited nodes and edges in the graph will be shown in grey. Figure: Shows a traversed graph with starting node 3. The untraversed edges and nodes are shown in grey. 3. Format for Graph Specification: The applet reads graph from a file that specifies the graph in following format. a) All the statements starting with ‘#’are treated as comments and ignored. b) Specify number of nodes in digits like 1,2 etc. c) Optionally, X and Y co-ordinates are specified to display the nodes of the graph. The graph display is divided in a 1000 X 1000 co-ordinate system. d) If the required numbers of co-ordinates not specified, the graph nodes are displayed in a circle. e) Specify the graph type by using the characters ‘U’ (Undirected) or ’D’ (Directed). f) Specify the number of edges. g) In a separate line, for each edge, specify the starting and the ending node. A file format example is shown below: # You can include more comments using the ‘#’ sign 6 # Number of vertices the cds for each vertex are below 10 40 # The X and Y co-ordinates 700 10 200 250 400 280 40 900 650 850 U #Undirected graph 8 # Number of edges 0 4 # the starting and the ending node for each edge 02 21 23 25 15 54 35 If there is any error in reading the graph file, an error message is displayed in the text field and in the graph display area. Software Documentation: 4. Code Explanation: The following classes are used to animate the graph. The explanation for each of the classes is given below. a) draw_main: The draw_main class is written in the draw_main.java file. This class contains the main () function. To compile the system you need to type in the following command: “ javac draw_main.java ” To run the system you need to type in the following command: “ java draw_main “ The class “draw_main” calls the drawGraph class. The control flow is shown below. Calls draw_main drawGraph The draw_main has only one function main () where the program execution begins. b) drawGraph: The drawGraph function written in draw_main.java file, creates and controls the user interface and interaction of the entire system. The following Java swing classes are used to create the user interface. - JFrame - JPanel - JTextPane - JScrollPane - JButton - JComboBox Other java classes used are as follows: - String - Style - StyleConstants Besides java classes, the following classes that have been written as a part of this thesis work are also imported to create the user interface and show graph animation. - FileDialogBox - drawNodes - BFSAlgorithm - NodeCds - Instructions Each of the above class is explained in detail below. Apart from these classes, Java Action Listeners have been used for creating the buttons and the combo box. Document interface has been used for the JTextPane class. The constructor of the class i.e. drawGraph () creates the display area that draws the graph, the text area that displays the messages during run time and the buttons and the combobox that allows the user to interact with the system. The method summary of the drawGraph class: a) ActionPerformed (): This function is called when the user presses any of the buttons on the user interface. Depending on the button pressed, appropriate action is taken. b) Display_file () This method is called when the ‘Input’ button is pressed. It creates an instance of the FileDialogBox Class that allows the user to select a file that has proper specifications to display the graph. c) Display_nodes () This function is called by the display_file () method if the graph is properly read from the file. It initializes the drawNodes class that displays the graph. c) Run_BFSalgorithm () If the algorithm selected by the user is BFS, this method is called when the user clicks on the ‘Next’ button. It initializes the BFSAlgorithm class that runs the BFS algorithm and AQueue class that implements queue for the BFS algorithm. It updates the display of the graph i.e. higlights the appropriate node and edge, to animate it, each time the ‘Next’ button is pressed by passing appropriate parameters to the paint () method of the drawNodes class. d) Run_DFSalgorithm () If the algorithm selected by the user is DFS, this method is called when the user clicks on the ‘Next’ button. It initializes the BFSAlgorithm class that intializes the graph used to run the DFS algorithm. It updates the display of the graph i.e. highlights the appropriate node and edge, to animate it, each time the ‘Next’ button is pressed by passing appropriate parameters to the paint () method of the drawNodes class. e) Run_DFSAlgo (int NODE) The above method is called by the run_DFSAlgorithm (). It implements the DFS algorithm i.e. traverses the graph for the node that is passed to it. Edges traveresed and the nodes visited, are stored in appropriate arrays and displayed one by one by when the user presses the Next button. f) POP () The above method implements the pop operation of the DFS stack. g) PUSH (int v) The above method implements the push operation of the DFS stack h) Message (String color) This method is called to display a message in the text field. The control flow for the drawGraph class is given below: drawGraph drawNodes BFSAlgorithm Instructions FileDialogBox NodeCds c) drawNodes: The drawNodes class is written in drawNodes.java file. It performs the graphics operation for the animation. The class inherits its method from the swing class JComponent. The drawNodes class displays the graph read from the file. DrawGraph passes the file name having the graph specification, it then passes this name to the NodeCds class which returns the co-ordinates to draw the nodes and the start and end point of the edges of the graph. The drawNodes class implements mouselistener to allow the users to select the starting node of the graph traversal just by clicking on it. The starting node is then passed to the draw_main class. The method summary for the drawNodes class: a) Paint () This function performs all the graphics operation for the system. b) set_nodeselected() This function highlights the starting node selected by the user. c) NodeSelected () This function returns the node selected by the user to other classes. d) Color_vertex () The above function is called to highlight a node to mark it visited. e) Color_edge () This function highlights the traversed edges. The edges that are in the BFS/DFS tree are shown in a different color than other traversed edges not in the BFS/DFS tree. f) Queue_add () This function adds a node to the BFS queue. g) Queue_remove () This function removes a node from the BFSqueue. h) Reset () This function is used after the graph traversal is finished to reset the last step of the algorithm. i) Restart () This function is used to redraw the un-traversed graph, when the user clicks on the ‘Restart’ button. j) Node_notEditable () This function is used to disable users to change the starting node selected. k) GraphValid () This function is used to determine if the graph is read properly or not. l) Draw_Stack () This function draws the stack for the DFS algorithm. m) DisplayPointer () This function is used to display error messages. n) resetdrawNodes() Resets the last animated edge. Without this, after the animation is finished the last edge will be displayed as dark green. The control flow for drawNodes is shown below: drawNodes draw_main NodeCds d) fileInput class: This class reads the graph specifications from the file selected by the user. It uses the Java io and util classes. ‘NodeCds’ class initializes this class. The method summary for the fileInput class: a) ReadGraph () This function reads the graph values, i.e. number of nodes, number of edges, starting and ending nodes for each edge from the file. b) Graph_isvalid () This function is used to check if the graph has been properly read. c) Cds () This function is used to determine if the user has specified the co-ordinates of the nodes. d) Number_nodes () This function returns the number of nodes in the graph. e) IfNull () This function gets rid of all the blank lines while reading the file. f) String graph_type () This function returns the graph type, i.e. whether it is Directed/Undirected. g) Xcds () If the user has specified the co-ordinates for the nodes, this function returns the X co-ordinates of the nodes. h) Ycds () If the user has specified the co-ordinates for the nodes, this function returns the Y co-ordinates of the nodes. i) Number_of_edges () This function returns the number of edges in the graph. j) Starting_node () This function returns the starting nodes of the graph edges. k) Ending_node () This function returns the ending nodes of the graph edges. l) DisplayPointer () This function is used in error display. The control flow for this class is shown below: fileInput NodeCds e) NodeCds class: This class calculates the co-ordinates for each of the graph nodes. The method summary for the NodeCds class: a) Setcds () This function is called to calculate co-ordinates to draw the graph nodes if the user has not specified them. b) Setcdsgiven () If the user has specified the co-ordinates for each node, this function is called to map the cds specified by the user to the actual co-ordinates used for drawing the nodes. c) No_of_nodes () This function passes the number of nodes in the graph to the other classes. d) No_of_Edges () This function passes the number of edges in the graph to the other classes. e) DrawAtX () This function passes the X co-ordinates of each of the graph nodes to the other classes. f) DrawAtY () This function passes the Y co-ordinates of each of the graph nodes to the other classes. g) Graph_Assertion () This function returns to the calling function value specifying whether the graph has been properly read or not. h) Graph_Type () This function returns to the calling function the type of the graph i.e. whether it is an Undirected/Directed graph. i) Starting_nodes () This function returns the starting nodes of the edges of the graph. j) Ending_nodes () This function returns the ending nodes of the edges of the graph . k) DisplayPointer ( ) This function is used to display error messages. The control flow of this class is as follows: NodeCds draw_main drawNodes fileInput f) FileDialogBox: This function returns the name of the file selected by the user. The method summary for the FileDialogBox class: a) Return_file () Returns name of the file that has been selected by the user. The control flow of this class is as follows: FileDialogBox draw_main g) Instructions: This class is displays the help manual when the user presses the ‘help’ button. The method summary for the Instructions class: a) Message () This function is used to display a string in the text area. b) getrid () This function disables more than one help manual open at a time. It will destroy the old manual window before displaying the new one. The control flow of this class is as follows: Instructions draw_main h) BFSAlgorithm: This class is used as an interface to the Graphm class that is used from an external code not developed as a part of this thesis. This class is used to initialize the graph from the Graphm class that is used to run the BFS/DFS algorithm. The following is the summary of its methods: a) Main_graph() Returns the graph that is intialized by the BFSAlgorithm class to the draw_main class. The control flow of this class is as follows: External classes BFSAlgorithm NodeCds draw_main Besides the above classes, the following classes are also used but were not written as part of this thesis. - AQueue - Graph - Assert - Gmain - Graphm - Edgem - Queue Source: "A Practical Introduction to Data Structures and Algorithm Analysis" By Clifford A. Shaffer, Prentice Hall, 1998. Copyright 1998 by Clifford A. Shaffer The control flow for the entire system: draw_main Instructions drawNodes drawGraph FileDialogBox NodeCds BFSAlgorithm fileInput External classes


