Accelerated Physics Lab
advertisement
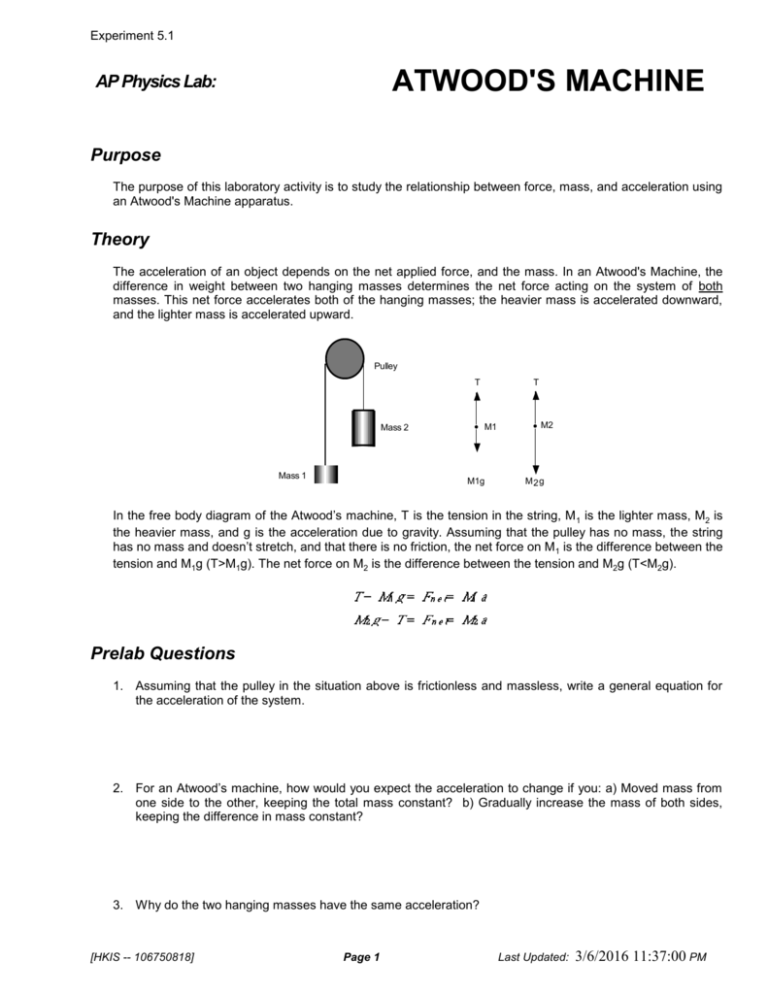
Experiment 5.1 ATWOOD'S MACHINE AP Physics Lab: Purpose The purpose of this laboratory activity is to study the relationship between force, mass, and acceleration using an Atwood's Machine apparatus. Theory The acceleration of an object depends on the net applied force, and the mass. In an Atwood's Machine, the difference in weight between two hanging masses determines the net force acting on the system of both masses. This net force accelerates both of the hanging masses; the heavier mass is accelerated downward, and the lighter mass is accelerated upward. Pulley T T M1 Mass 2 Mass 1 M1g M2 M2g In the free body diagram of the Atwood’s machine, T is the tension in the string, M 1 is the lighter mass, M2 is the heavier mass, and g is the acceleration due to gravity. Assuming that the pulley has no mass, the string has no mass and doesn’t stretch, and that there is no friction, the net force on M1 is the difference between the tension and M1g (T>M1g). The net force on M2 is the difference between the tension and M2g (T<M2g). Prelab Questions 1. Assuming that the pulley in the situation above is frictionless and massless, write a general equation for the acceleration of the system. 2. For an Atwood’s machine, how would you expect the acceleration to change if you: a) Moved mass from one side to the other, keeping the total mass constant? b) Gradually increase the mass of both sides, keeping the difference in mass constant? 3. Why do the two hanging masses have the same acceleration? [HKIS -- 106750818] Page 1 Last Updated: 3/6/2016 11:37:00 PM Experiment 5.1 Procedur For this experiment you will keep the difference In mass between the two sides of the Atwood's machine constant and increase the total mass. 1. Set up the Atwood’s machine apparatus as shown in Figure 1. Be sure the heavier mass can move at least 40 cm before striking the floor. 2. Connect the Photogate with Super Pulley to DIG/SONIC 1 of the interface. 3. Open the file “10 Atwoods Machine” in the Physics with Vernier folder. A graph of velocity vs. time will be displayed. 40 cm 4. Put 20 g on m1and 0 g on m2. Use the lab electronic balance to get the exact masses. Then, hold the masses steady, 11. Add mass in 20 g increments to both sides, keeping a constant difference of 20 grams. Record the resulting mass for each combination in the data table. Repeat Steps 6–7 for each combination. Repeat the procedure until you get at least five different combinations. What is the . acceleration of this combination? Record your values for mass and acceleration in the data table. 6. Position m1 as high up as it can go. Click to begin data collection. Steady the masses so they are not swinging. Wait one second and release the masses. Catch the falling mass before it strikes the floor or the other mass strikes the pulley. 7. Click the Examine button and select the region of the graph where the velocity was increasing at a steady rate. Click the Linear Fit button to fit the line y = mt + b to the data. Record the slope, which is the acceleration, in the data table. 8. Continue to move masses from m2 to m1 in 5 g increments, changing the difference between the masses, but keeping the total constant. Repeat Steps 6–7 for each mass combination. Repeat this step until you get at least five different combinations. 1. Set up the laboratory similar to the diagram on the right. 2. Connect the Smart Pulley® to port #1 and start the Science Workshop program. Drag the digital plug to channel 1 and then select “Smart Pulley – Linear” from the list. Then drag the graph window to channel one and select “Velocity, v [m/s]”. 3. From the top menu choose EXPERIMENT / SAMPLING OPTIONS. Choose "Start Conditions" and click the option button entitled "Channel." 4. Another dialog box will be displayed. Choose State = "Low Blocked Gate" as shown to the right and then click <OK>. You will need to click <OK> in the "Sampling [HKIS -- 106750818] Options" Page 2 Last Updated: 3/6/2016 11:37:00 PM Experiment 5.1 dialog box as well. 5. Place about 100 grams of mass on one mass hanger and record the total mass as M 1. Be sure to include mass from the mass hanger in the total mass. Place slightly more than 100 grams on the other hanger. Record this total mass as M2. 6. Move the heavier of the two masses upward until the lighter mass almost touches the floor. Hold the heavier mass to keep it from falling. Turn the pulley so that the photogate beam of the Smart Pulley is unblocked (the red light-emitting diode (LED) on the photogate does not light). With the masses motionless, press <REC> button on the main menu. 7. When ready, release the cart. Stop the timing by pressing <STOP> button just before the hanging mass reaches the floor. Be certain to that the lighter mass does not hit the Smart Pulley! 8. Maximize the graph window then zoom in on the graph with the the tool. If you need to zoom in more use tool by dragging a selection rectangle over the area you wish to zoom in on. Select the region of the graph that includes the increasing velocity (accelerating) portion of the graph then choose the tool and then the drop-down menu choosing the “Curve Fit – Linear” option. 9. The computer will generate a linear curve fit of the form: y = a1 + a2 x, where a1 is the y-intercept and a2 is the slope of the curve. Record the a2 value listed, which is the acceleration, in your data table. 10. For the data table, change the hanging mass on each hanger adding the same amount of mass to both weight hangers. This will increase the total mass without changing the net force. Record your new values of mass in the data table. Repeat this step for at least five different combinations of mass. [HKIS -- 106750818] Page 3 Last Updated: 3/6/2016 11:37:00 PM Experiment 5.1 Data Tables Data Table #1: Constant Net Force Trial M1 (kg) M2 (kg) aexp (m/s2) Fnet (N) M1+ M2 (kg) atheory (m/s2) % Diff. 1 2 3 4 5 6 7 8 Analysis/Questions 1. Without actually graphing your data from the data table, what would a graph of a graph of acceleration vs. 1/(total mass) look like? What would be the slope? 2. Create the graph, and show numerically with your data what you explained in number 1. 3. How does the tension in the string change as the system begins accelerating? Images and some text taken from "Physics with Calculators", Venier Software and "Science Workshop Labs", Pasco Scientific. [HKIS -- 106750818] Page 4 Last Updated: 3/6/2016 11:37:00 PM
