Lab 1: Atwood's Machine
advertisement
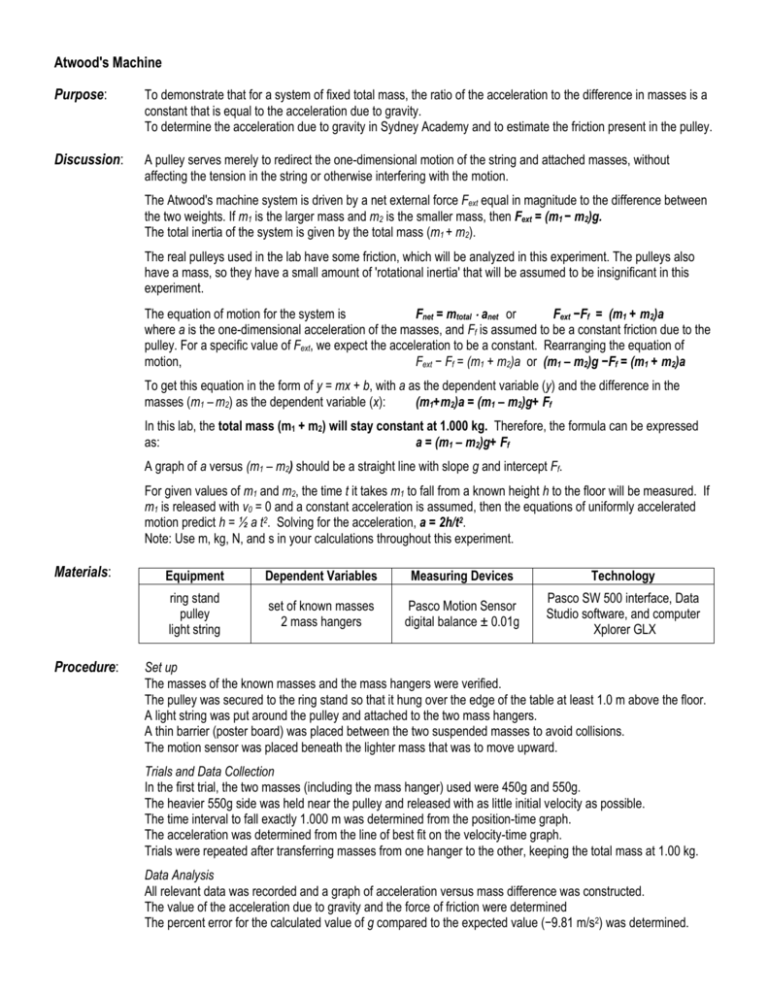
Atwood's Machine Purpose: To demonstrate that for a system of fixed total mass, the ratio of the acceleration to the difference in masses is a constant that is equal to the acceleration due to gravity. To determine the acceleration due to gravity in Sydney Academy and to estimate the friction present in the pulley. Discussion: A pulley serves merely to redirect the one-dimensional motion of the string and attached masses, without affecting the tension in the string or otherwise interfering with the motion. The Atwood's machine system is driven by a net external force Fext equal in magnitude to the difference between the two weights. If m1 is the larger mass and m2 is the smaller mass, then Fext = (m1 − m2)g. The total inertia of the system is given by the total mass (m1 + m2). The real pulleys used in the lab have some friction, which will be analyzed in this experiment. The pulleys also have a mass, so they have a small amount of 'rotational inertia' that will be assumed to be insignificant in this experiment. The equation of motion for the system is Fnet = mtotal anet or Fext −Ff = (m1 + m2)a where a is the one-dimensional acceleration of the masses, and Ff is assumed to be a constant friction due to the pulley. For a specific value of Fext, we expect the acceleration to be a constant. Rearranging the equation of motion, Fext − Ff = (m1 + m2)a or (m1 – m2)g −Ff = (m1 + m2)a To get this equation in the form of y = mx + b, with a as the dependent variable (y) and the difference in the masses (m1 – m2) as the dependent variable (x): (m1+m2)a = (m1 – m2)g+ Ff In this lab, the total mass (m1 + m2) will stay constant at 1.000 kg. Therefore, the formula can be expressed as: a = (m1 – m2)g+ Ff A graph of a versus (m1 – m2) should be a straight line with slope g and intercept Ff. For given values of m1 and m2, the time t it takes m1 to fall from a known height h to the floor will be measured. If m1 is released with v0 = 0 and a constant acceleration is assumed, then the equations of uniformly accelerated motion predict h = ½ a t2. Solving for the acceleration, a = 2h/t2. Note: Use m, kg, N, and s in your calculations throughout this experiment. Materials: Procedure: Equipment Dependent Variables Measuring Devices Technology ring stand pulley light string set of known masses 2 mass hangers Pasco Motion Sensor digital balance ± 0.01g Pasco SW 500 interface, Data Studio software, and computer Xplorer GLX Set up The masses of the known masses and the mass hangers were verified. The pulley was secured to the ring stand so that it hung over the edge of the table at least 1.0 m above the floor. A light string was put around the pulley and attached to the two mass hangers. A thin barrier (poster board) was placed between the two suspended masses to avoid collisions. The motion sensor was placed beneath the lighter mass that was to move upward. Trials and Data Collection In the first trial, the two masses (including the mass hanger) used were 450g and 550g. The heavier 550g side was held near the pulley and released with as little initial velocity as possible. The time interval to fall exactly 1.000 m was determined from the position-time graph. The acceleration was determined from the line of best fit on the velocity-time graph. Trials were repeated after transferring masses from one hanger to the other, keeping the total mass at 1.00 kg. Data Analysis All relevant data was recorded and a graph of acceleration versus mass difference was constructed. The value of the acceleration due to gravity and the force of friction were determined The percent error for the calculated value of g compared to the expected value (−9.81 m/s2) was determined. Results Accelerations of the larger mass for varying differences in mass. Each mass includes the mass of the mass hanger. The height the larger mass (Mass 1) fell was 1.000 m for all trials. Time Interval to Mass 1 Mass 2 Mass Difference Acceleration Trial fall 1.000m (kg) (kg) (kg) (m/s2) (s) 1 Traditional Table 1 2 3 4 5 Technological 1 2 3 4 5 Sample Calculations Table 2 Calculations of values for graph of (m1 + m2) a = (m1 – m2) g – Ff . x Trial Mass Difference m1 – m2 (kg) y Total Mass m1 + m2 (kg) Acceleration a (m/s2) Traditional 1 2 3 4 5 Technological 1 2 3 4 5 Acceleration due to Gravity (g) = slope from graph = _______________________ Force of Friction (Ff) = y-intercept from graph = _______________________ Total Mass and Acceleration (m1 + m2)a (kg m/s2)

