Kamin Models Reivew Packet
advertisement
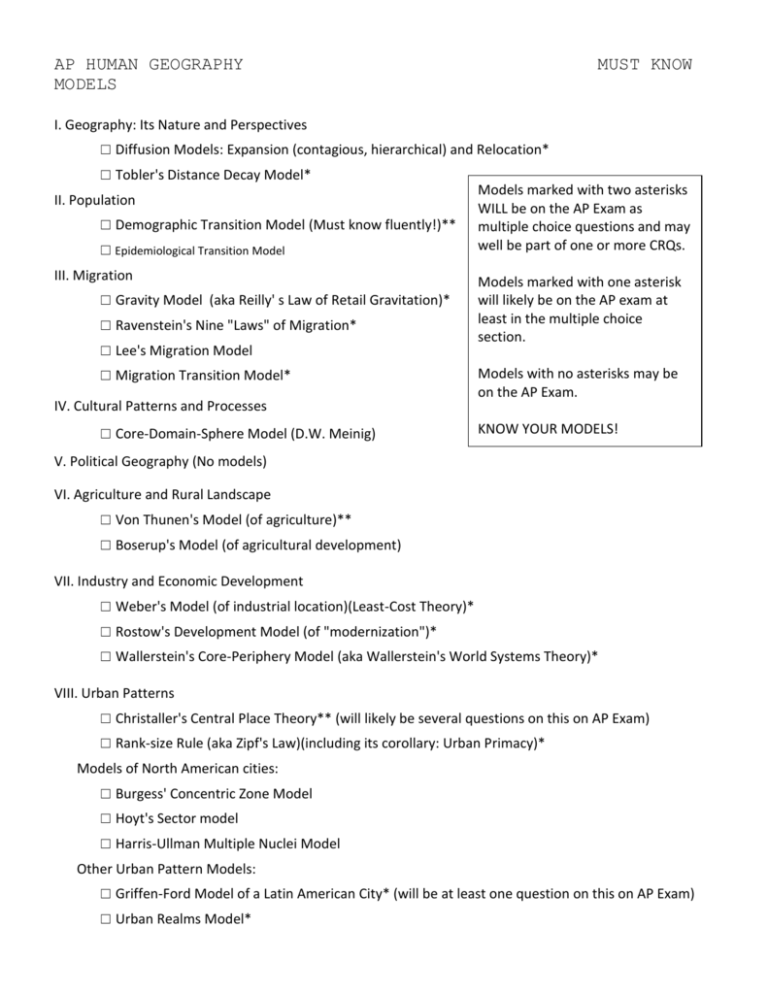
AP HUMAN GEOGRAPHY MODELS MUST KNOW I. Geography: Its Nature and Perspectives ☐ Diffusion Models: Expansion (contagious, hierarchical) and Relocation* ☐ Tobler's Distance Decay Model* II. Population ☐ Demographic Transition Model (Must know fluently!)** ☐ Epidemiological Transition Model III. Migration ☐ Gravity Model (aka Reilly' s Law of Retail Gravitation)* ☐ Ravenstein's Nine "Laws" of Migration* ☐ Lee's Migration Model ☐ Migration Transition Model* IV. Cultural Patterns and Processes ☐ Core-Domain-Sphere Model (D.W. Meinig) Models marked with two asterisks WILL be on the AP Exam as multiple choice questions and may well be part of one or more CRQs. Models marked with one asterisk will likely be on the AP exam at least in the multiple choice section. Models with no asterisks may be on the AP Exam. KNOW YOUR MODELS! V. Political Geography (No models) VI. Agriculture and Rural Landscape ☐ Von Thunen's Model (of agriculture)** ☐ Boserup's Model (of agricultural development) VII. Industry and Economic Development ☐ Weber's Model (of industrial location)(Least-Cost Theory)* ☐ Rostow's Development Model (of "modernization")* ☐ Wallerstein's Core-Periphery Model (aka Wallerstein's World Systems Theory)* VIII. Urban Patterns ☐ Christaller's Central Place Theory** (will likely be several questions on this on AP Exam) ☐ Rank-size Rule (aka Zipf's Law)(including its corollary: Urban Primacy)* Models of North American cities: ☐ Burgess' Concentric Zone Model ☐ Hoyt's Sector model ☐ Harris-Ullman Multiple Nuclei Model Other Urban Pattern Models: ☐ Griffen-Ford Model of a Latin American City* (will be at least one question on this on AP Exam) ☐ Urban Realms Model* DIFFUSION MODELS A. Verbal description of model (what does the model attempt to describe or predict?): Diffusion models attempt to describe and predict the process by which phenomena spread across space. B. Graphic representation of model: C. Key points: 1. Relocation diffusion: the spread of an idea through the physical movement of people (migration) from one place to another. If enough people move, the idea can die out at the hearth. (Examples: Amish or Christianity to N. America, horses to N. America, languages, initial phase of AIDS, crops, religions (initially). 2. Expansion diffusion: the spread of an idea throughout a population from area to area in a snowballing effect. Idea, not people, moves. Total number of adopters grow but idea stays strongest at hearth. Three subtypes (below). 3. Contagious diffusion: the rapid, wavelike spread of a phenomenon throughout a population by person to person contact without regard to hierarchy (no jumping). Key concept: proximity. Examples: disease, anything on internet, adoption of horses or Christianity by native Americans. 4. Hierarchical diffusion: the spread of a phenomenon from powerful persons or places (nodes of authority) such as elites or major cities. Key concept: innovation leapfrogs or jumps over large areas. Examples: fashion (traditionally), Hip Hop, "economic command centers". 5. Stimulus diffusion: the original idea spreads by stimulating versions of itself in local areas. Example: Veggie burger fast food in India, reindeer herding by Inuit, skateboarding was "inland surfing", gang culture to suburbs. 6. Related terms/concepts: hearth, periphery, independent invention, 3 types of diffusion barriers (physical, cultural, economic), distance decay, time-space compression, S-shaped adoption curve (early adopters, majority adopters, laggards). D. Takeaway(s): In the real world, these various types of diffusion are at work simultaneously. For example, hierarchical diffusion is often followed by contagious diffusion. Spatial diffusions are perhaps the most fundamental of all geographic models because they help to explain the spread of such diverse phenomena as migration, disease, technology, religion, music, fashion, language, agricultural innovation, etc. (TOBLER'S) DISTANCE DECAY MODEL A. Verbal description of model (what does the model attempt to describe or predict?): The model attempts to describe and predict the effect of distance on spatial interaction. It posits that the interaction between two locales declines as the distance between them increases. B. Graphic representation of model: C. Key points: 1. Tobler's First Law of Geography: "Everything is related to everything else but near things are more related than distant things." 2. Friction of Distance is simply the force that causes distance decay. 3. Applications throughout the course: a. diffusion: Distance decay predicts that the farther away a place is from a hearth and the longer it takes an innovation to reach its potential adopters, the less likely the innovation will be adopted, and the fewer people will adopt the innovation. b. Migration: One of Ravenstein's laws states that most people migrate short distances within their own country, a clear example of distance decay. c. Industry: Distance decay is central to Weber's Least Cost Industrial Location Theory (transportation costs increase with distance and therefore dictate industrial location.) d. Culture: Agricultural innovations, language, religion, cultural traits, all tend to decrease in influence as one moves farther from their hearths. e. Urban Geography: Distance Decay is implicit in Central Place Theory in that the boundaries of each market areas is based on the gradual decline in the economic reach of that market area's central place. D. Takeaway(s): We should never forget that even in the age of ever increasing time-space compression (air travel, cell phones, internet), distance remains the single most important determining factor in spatial interaction. THE DEMOGRAPHIC TRANSITION MODEL A. Verbal description of model (what does the model attempt to describe or predict?): The demographic transition model attempts to show how the population of a country changes over time as it transitions from an agrarian to an industrial and then to a post industrial society. It posits that all countries go through a series of four demographic stages from the high birth and death rates of preindustrial subsistence societies to the low birth and death rates in post-industrial societies. B. Graphic representation of model: C. Key points (you should be able to explain each stage in terms of CBR, CDR, NIR, and population growth and size): Stage 1 = high CDR and high CBR, low (almost zero) NIR (around .05%), stable (small) population size Stage 2 = CDR declines rapidly, CBR remains high, increasing NIR, rapid population growth Stage 3 = CDR decline continues but slows, CBR declines, decreasing NIR, moderate, slowing pop growth Stage 4 = low CDR and low CBR, low NIR, stable (now large) population size Causes of transition between Stage I and Stage II: increased food supply/production diffusion of medical technology (especially against so-called "child-killers") increase in overall health/life expectancy improved sanitation (sewage systems, personal hygiene) Industrial Revolution Causes of transition between Stage II and Stage III: gradual realization that large families not needed declining infant mortality (no need to replace these children) urbanization (children more of a cost than a benefit than in country/less space for large families) diffusion of contraception/family planning increased education of women increased status of/opportunities for women delayed age of marriage/first child Countries whose experiences may not support the model: 1. Middle Eastern countries/African Countries/Cape Verde: These countries moved received medical technologies and moved to stage II without receiving the whole suite of cultural, political and economic changes that increase the status of women and lead to lower CBRs. (Example: social taboos, political opposition or cost slow the diffusion of contraception, children still seen as status symbol even after IMR fall, religious opposition to the education of girls). 2. China (or any other country with successful pro- or anti-natalist policies): China used sterilization and economic policies to force CBRs down faster than suggested by the model. 3. South Korea (also Malaysia, Singapore, Hong Kong and the other so-called "tiger economies"): Because of rapid economic, political, and social changes after WWII South Korea moved through its demographic transition on a much shorter time scale than the model predicted. 4. Countries with high levels of AIDS (Botswana, Swaziland, Lesotho) or other lethal diseases may actually see such high CDRs in the future that they may revert to stage one of the model. Water shortages in Bangladesh or elsewhere may have the same effect of making it nearly impossible to reduce death rates despite generally improving conditions for the people in these countries. 5. Some countries (Japan, Croatia, Bosnia, Italy, Spain, Sweden, and Russia) are showing CDRs higher than CBRs and therefore negative NIRs and declining populations. If this continues it may suggest the need for a fifth stage of the demographic transition model. D. Takeaway(s): The transition from Stage I to Stage II is based largely on the diffusion of TECHNOLOGY. The transition from Stage II to Stage III is largely based on CULTURAL factors, particularly the status of women. Therefore many LDCs are stuck in the stage II (the "demographic trap"). European countries took centuries to move through the four stages of the DTM while many LDCs are being asked (unfairly?) to move through the stages in a matter of decades due to issues related to the carrying capacity of their regions. EPIDEMIOLOGICAL TRANSITION MODEL A. Verbal description of model (what does the model attempt to describe or predict?): A companion model to the Demographic Transition Model, the Epidemiological Transition model simply identifies specific causes of death with each of the stages of the DTM. B. Key points: Stage I: Stage of pestilence and famine. Infectious and parasitic diseases were primary causes of death and kept human population in check during stage I of DTM. (i.e. Black Plague, typhus, cholera, small pox.) Stage 2: Stage of receding pandemics. Pandemics receded due to improved sanitation, medicine, and nutrition diseases. BUT: cholera spread quickly as poor people crowd into rapidly growing industrial cities. Stages 3: Stage of degenerative diseases. As people live longer and vaccinations virtually eliminate infectious disease, people now die of chronic diseases associated with aging (heart disease, cancer, etc.) Stage 4: Stage of delayed degenerative diseases. New medicines and technologies extend the lives of those with degenerative diseases (statin drugs, heart surgeries, chemotherapy, etc.) Stage 5: Stage of reemergence of infectious diseases. Infectious diseases reemerge as they adapt and become immune to the antibiotics that have been used to control them THE GRAVITY MODEL A. Verbal description of model (what does the model attempt to describe or predict?): The Gravity Model attempts to predict the amount of spatial interaction (movement of people, goods, ideas, etc.) between two locations. More populated places attract people, goods, ideas, etc. more than less populated places, and places that are closer together have more spatial interaction than places that are distant from each other. Therefore, according to the model, the "pull" between two locations can be calculated by multiplying the population of Location A by the population of Location B and then dividing the product by the distance between the two locations squared. B. Graphic representation of model: Spatial Interaction = C. Key points: 1. Two factors in predicting the "pull" or gravity between two places: size of the locations and distance between them. 2. Size of location trumps (take precedence over) distance, since the sizes of the two places are multiplied. 3. Applications: Gravity Model can be used to predict: Transportation flows between two places, (more flow between larger and closer cities). The flow of immigrants to a particular place (larger and closer cities exert a stronger pull on migrants) The range of influence of a business or settlement in the Central Place Model. The Gravity Model predicts that the optimal location of a service is directly related to the number of people in the area and inversely related to the distance people must travel to access it. D. Takeaway(s): Why might time of travel rather than distance yield a more accurate prediction of the pull of two places on each other? What might be some built in limitations to the Gravity Model? What economic, political, or social factors might outweigh both proximity and size as predictors of the pull of a location on other locations? Does the Gravity Model support or reject Tobler's Law of Distance Decay? RAVENSTEIN'S NINE "LAWS" OF MIGRATION A. Verbal description of model (what does the model attempt to describe or predict?): Ravenstein's Laws of Migration were an early attempt to answer three questions: a. Why do people migrate? b. How do people migrate? c. Who migrates? B. Key points: Why do people migrate? 1. Most people migrate for economic reasons. 2. People also migrate for environmental and cultural reasons, but less often than for economic reasons. How do people migrate? 3. Most people migrate short distances within their own country. 4. Long distance migrants usually move to urban areas or areas of major economic activity. 5. People migrate in steps. (Step migration) 6. Every migration flow generates a return or countermigration flows in the opposite direction (though not necessarily at the same volume). Who migrates? 7. Over long distances, men migrate more than women. Over shorter distances within a country, women migrate more than men. 8. Most long distant migrants are young adults rather than families with children. 9. Rural dwellers migrate more than city dwellers. C. Takeaway(s): Ravenstein's Laws describe well the general patterns of migration Ravenstein's witnessed in the late 19th century but do not go very far in explaining the individual factors that migrants most weigh in deciding whether to migrate. LEE'S MIGRATION MODEL A. Verbal description of model (what does the model attempt to describe or predict?): Lee's Migration Model attempts to explain migration as a very personal decision based on: a. Push and pull factors at the migrant's place of origin b. Push and pull factors at the migrant's destination c. Intervening obstacles or opportunities lying between the place of origin and destination, and B. Graphic representation of model: C. Key points: Push Factors Economic no jobs, jobs with no future, poor health care, education, or other services, population pressures, high taxes Cultural crime, poor marriage opportunities,, perceived threat to way of life (S. Africans moved to Australia after Apartheid) Political war (Vietnam, Rwanda, Balkans), poor governance, political, ethnic, religious persecution (Sudan, Palestine, Indian Partition), lack of democracy or human rights, political instability Environmental unhealthy/polluted environment, drought (Sahel), no clean water, famine (Ireland) Intervening Obstacles or Opportunities jobs/economic opportunity, cost of migrating more career choices, need for (transport, food, housing, guest workers, government passport/visa), job found assistance for immigrants along the way (intervening (Germany), affordable housing opportunity) language barriers, kinship links, better status and illiteracy/lack of education, opportunities for women, family pressure to stay, entertainment (pulls young large children (make it people to cities), harder to migrate) demographics (more people misinformation about my age!), marriage destination, hostility opportunities towards immigrants selective migration policies (skilled workers recruited) selective migration policies, government incentives visa restrictions, quotas (US (Indonesians paid to leave lets in Cubans but not Java), colonial ties (N. Africans Haitians, S. Africa only let in to France), political or "pure" Europeans) religious freedom, political stability Pull Factors back to nature (can go rural and still be connected), desirable climate (Southern US for retirees), slower pace of life DISTANCE!, natural barriers (oceans, rivers, mountains, deserts), man-made barriers (US/Mexico wall, Berlin Wall, Great Wall of China, Israeli Green Wall (ZELINSKY'S) MODEL OF MIGRATION TRANSITION A. Verbal description of model (what does the model attempt to describe or predict?): A companion model to the Demographic Transition Model, the Zelinsky Model of Migration Transition claims that the type of migration that occurs within a country depends on its level of development. B. Graphic representation of model: C. Key points: Same stages as DTM (Demographic Transition Model) but applied to migration patterns: Stage 1: Preindustrial: Little or no permanent migration. People move only daily or seasonally in search of food. Stage 2: Transitional: Migration is rural to urban (improved agricultural practices reduces need for farm labor and new factories draw that extra labor to cities) AND international (Because of rapid population growth and job competition during stage 2, workers move not only to cities within their own country but also to other countries in search of jobs). Stages 3 and 4: Industrial and Post-Industrial: Migration is internal intraregional (from cities to suburbs in MDCs). Stage 3 and 4 countries are also commonly the destination for immigrants from stage 2 countries who are in search of jobs due to population growth in their countries of origin. D. Takeaway(s): Main point: According to the Zelinsky model, international migration takes place primarily during stage 2 (transition to industrialization) whereas internal migration is more important in stages 3 and 4 (as a country becomes more developed). CORE-DOMAIN-SPHERE MODEL A. Verbal description of model (what does the model attempt to describe or predict?): The Core Domain Sphere Model attempts to define or describe culture zones based on the prevalence of cultural elements associated with a cultural phenomenon (Mormon culture zone, "the Muslim World", "the Southwest U.S.", Christendom, German speaking Europe, etc.) B. Graphic representation of model: C. Key points: Core: All cultural elements are present and the culture predominates. Domain: Some culture elements are present and obvious. Sphere: Few of the identified cultural elements are present. Note: A given location can be in the core, domain, or sphere depending on which cultural element or elements are identified. (Mormon settlement patterns, number of Mormons, number of Mormon temples, etc.) D. Takeaway: The Core Domain Sphere Model gives geographers a way to at least tentatively describe the area in which certain culture traits have influence and makes it possible to study such hard to define cultural zones as "the Muslim World" or "The Bible Belt". VON THÜNEN MODEL OF AGRICULTURAL LAND USE A. Verbal description of model (what does the model attempt to describe or predict?): Von Thunen's Model attempts to describe and predict the spatial distribution of different types of agriculture on the basis of transportation costs and land values. In particular, his model tries to explain a similar pattern of concentric rings of different crops which he observed around towns in N. Germany. B. Graphic representation of model: C. Key points: 1. Assumptions: Von Thünen "assumed away" site factors (below) but the model can be adjusted for them. Von Thünen's Model assumes: 1) flat terrain, 2) uniform soil quality, 3) uniform climate, and 4) no barriers to transportation to the central market. He also assumed that farmers make decisions so as to maximize profit (probably a safe assumption!) 2. Conclusions: a. Bottom line: Transportation costs determine how farmers can make the most profitable use of their land. b. If they could, all farmers would chose to produce agricultural products like dairy, fruit, and vegetables because they are most profitable. These products are also labor intensive and therefore expensive to grow. They are also perishable. But (and here's the key) as long as a farmer is close to the market and therefore has low transportation costs, he can afford to grow these intensive, high profit, perishable crops. c. But transportation costs rise as one moves farther from the market. At a certain distance from the market, it becomes unprofitable to produce these high profit (but high cost and perishable) crops. Farmers then are forced to chose crops that are less profitable but also less labor intensive and therefore cheaper to grow. These crops, because of their lower costs of production, can still be sold for a profit even though they are grown farther from town and therefore are more costly to transport to market. d. Result: the pattern shown in the graphic representation of the model above. Memorize the rings! D. Takeaway(s): The Von Thünen Model is well known in part because it was the first effort to analyze the spatial character of an economic activity. To this day geographers call similar patterns observed across a landscape "Thunian patterns". BOSERUP'S MODEL OF AGRICULTURAL DEVELOPMENT A. Verbal description of model (what does the model attempt to describe or predict?): Esther Boserup theorized that when population increased in a subsistence agriculturally based community the level of technology and labor efforts must and would increase to meet the demands of increased population pressures. B. Graphic representation of model: C. Key points: 1. The rate of population growth may approach but will not exceed the carrying capacity of the land because every time it is getting near, there will be an invention or development that causes the food supply to increase. The rapid increase in crop yields accomplished during the Green Revolution seem to have borne out her theory (at least for now). 2. In other words, Boserup argued that a rising population is not necessarily a cause for alarm (as the neoMalthusians argue) or even a bad thing because population brings with it a larger labor force and drives creativity and innovation, all of which lead to increased food production. 3. Boserup's model is part of Cornucopian Theory, which argues that human ingenuity will always result in innovations that will expand food supply. Cornucopian Theory is therefore a counter argument to neoMalthusians, who argue that there is a natural limit to the earth can support at a comfortable standard of living. They argue, like Malthus did, that population growth will eventually outstrip food supply because population grows exponentially (2, 4, 8, 16…) whereas food supply increases only arithmetically (1, 2, 3, 4…). 4. Cornucopians like Boserup might say: "Look at Europe. It is very densely populated but people have figured out how to sustain a very high standard of living with a high population." Neo-Malthusians would answer: "Yes, all well and good. But if the whole world used resources as the level of Europe, we would need five more planet earths to sustain that standard of living for everyone. There must be some limit to the carrying capacity of the earth." WEBER'S LEAST COST THEORY/MODEL OF INDUSTRIAL LOCATION A. Verbal description of model (what does the model attempt to describe or predict?): Weber's Least Cost Theory attempts to describe and predict the location of manufacturing industries based on three factors: transportation costs, labor cost, and the benefit of agglomeration (clustering with similar, interdependent businesses). Of these, he considered transportation costs to be the dominant factor in determining where an industry would chose to locate. B. Graphic representation of model: C. Key points: 1. Weber's Least Cost Theory is based on tw site factor (labor and existence of similar industries in the vicinity (agglomeration) and one dominant situation factor: transportation costs. 2. Bulk-reducing industries such as steel or paper production in which the final product is easier to transport than the raw materials that go into their production will be located as near as possible to the raw materials (more expensive to transport inputs than the product). 3. Bulk-gaining industries, such as soft drink bottlers or automobiles in which the final product is more difficult to transport than the raw materials that go into their production will be located as near as possible to the customers (more expensive to transport the product than the inputs). 4. Weber realized that in some cases, savings from low cost labor or benefits from agglomeration (sharing skills, talents, and facilities with similar nearby industries) might convince an industry to locate farther from inputs or markets despite higher transportation costs. But transportation costs in this model are the dominant factor in the location of manufacturing industries. ROSTOW'S MODERNIZATION MODEL OF DEVELOPMENT A. Verbal description of model (what does the model attempt to describe or predict?): Rostow's Model of Development attempts to describe and predict patterns of development. Itargues that all countries follow a similar path to development through five predictable stages. LDCs will go through these stages of development just as MDCs once did. B. Graphic representation of model: C. Key points: . According to Rostow's model, development in LDCs depends on the sale of raw materials from LDCs to MDCs AND substantial capital investment and diffusion of technology from MDCs to LDCs. This opens the model to criticism of being neocolonial (carrying on exploitation of LDCs that began under colonialism.) Other Criticisms: No international context. Treats countries as autonomous units isolated from global forces. Development is not just based on what happens within a country (Mali not equal to Japan!) No domestic (local) context: No place in Rostow's model for war, political and cultural decision making. Has a Western, Industrial Revolution bias (conditions for "takeoff" for Great Britain in 1750 don't apply to LDCs.) Model assumes development is all good (what about costs of development to local cultures and the environment?) Need sixth stage: deindustrialization? Small is beautiful. WALLERSTEIN'S CORE-PERIPHERY MODEL/WORLD SYSTEMS THEORY A. Verbal description of model (what does the model attempt to describe or predict?): Like Rostow's Model, Wallerstein's World Systems Model attempts to describe and predict patterns of economic development. Unlike Rostow, Wallerstein did not see development as inevitable nor did he believe that all countries will develop in the same way. Instead, Wallerstein's model sees development in the context of a global capitalist system and division of labor in which core countries exploit the raw materials and cheap labor of periphery countries for profit. B. Graphic representation of model: C. Key points: Three regions in Wallerstein's Model: Core: Regions of higher levels of education, higher salaries, and higher levels of technology. The core gains power by exploiting the semi-periphery and periphery. Exploited by the core. Periphery: Periphery: lover levels of education, , lower salaries, less technologies. Exploited by the core and semi-periphery Generates less wealth in the world economy Semi-Periphery: Places where core and periphery processes are both occurring Places that are exploited by the core but then exploit the periphery 1. Exploitation is a function of the basic drive for profit in one interconnected global capitalist system. Development must be seen in this context. 2. The global capitalist market includes an international division of labor. This means industry can and will shift production from MDCs to LDCs in search of lowest labor costs (i.e. maquiladoras) 3. Raw materials and cheap labor flow from periphery to core. High profit consumption goods flow from core to periphery. 4. Wallerstein's model is useful at local scale. (Northeast is core, South is periphery of US, etc.) (CHRISTALLER'S) CENTRAL PLACE THEORY A. Verbal description of model (what does the model attempt to describe or predict?): Christaller's Central Place Theory attempts to describe and predict how settlements of different sizes are distributed over the landscape. In particular, it tries to show why larger settlements are few in number and far apart whereas smaller settlements are more numerous and closer to each other. B. Graphic representation of model: C=City (largest settlement type) T=Town (next smallest settlement type) V=Village (next smallest settlement type) H=Hamlet (smallest settlement type) C. Key points: 1. Settlements function as "central places" which compete against each other to provide services to their surrounding areas (which Christaller termed hinterlands or market areas). 2. Bigger settlements are fewer in number and farther apart because the services they provide are high range (aka high order) and high threshold services. High range services are services which people will travel a long distance to use. High threshold services are services that require a large number of customers to be profitable. The high range and high threshold of hospitals for instance mean that there won't be many of them (they can only exist in high density cities where there are enough "customers") and they can be spaced far apart (people will go a long way to get an operation). 3. Smaller settlements are larger in number and closer together because they provide low range and low threshold services. The low range and low threshold of grocery stores mean that there will be a lot of them (they don't need a lot of customers to turn a profit) and they will be spaced close together (people won't drive a long way for a gallon of milk.) 4. The model therefore predicts a so-called "urban hierarchy" of settlements: city, town, village, hamlet (largest to smallest). Larger settlements are less numerous and are spaced farther apart. Smaller settlements are more numerous and are spaced closer to each other. 5. The model uses hexagons to depict market areas around the central places because hexagons "nest" (they don't overlap or leave spaces between them). This represents well the idea that a person is always closer to one competing service or another (so there should be no spaces or overlap between market areas). Small hexagons also fit perfectly inside larger hexagons. This represents the idea that we are always within the "pull" of multiple central places: we will go to a large city for a heart transplant or a concert but we'll go to the local gas station for gas. RANK-SIZE RULE and URBAN PRIMACY (PRIMATE CITY) RULE A. Verbal description of model (what does the model attempt to describe or predict?): B. Graphic representation of model: C. Key points: RANK-SIZE RULE URBAN PRIMACY (PRIMATE CITY) RULE The Rank Size Rule and Urban Primacy Rule attempt to describe and predict the pattern observed in the sizes of cities within a country when ranking them from largest to smallest. German Cities Ranked By Population 1. Berlin 2. Hamburg 3. Munich 4. Cologne 5. Frankfurt 3,460,000 1,786,000 (about ½ of #1) 1,353,000 (about ⅓ of #1) 1,007,000 (about ¼ of #1) 679,000 (about ⅕ of #1) British Cities Ranked By Population 1. London 2. Birmingham 3. Glasgow 4. Leeds 5. Manchester 7,619,000 1,010.000 637,000 477,000 465,000 Note that the size of each city is roughly the size of the largest city (Berlin) divided by each city's rank. Therefore Germany follows the Rank-Size Rule. (Note that the largest city, London, is larger than twice the size of the next largest city, making it a primate city.) Therefore, Britain follows the Urban Primacy Rule. 1. The Rank-Size rule applies when a county's nth largest settlement is 1/n the size of the country's largest settlement. (e.g. the second larges settlement will be 1/2 the size of the largest, the third largest will be 1/3 the size of the largest, and so on. 1. The Urban Primacy (or Primate City) Rule applies when a country's largest settlement has more than twice as many people as the country's largest settlement. 2. A Rank Size distribution of settlements within a country indicates that a country is sufficiently wealthy to have goods and services widely distributed and available throughout its territory. 2. A country with a primate city will often suffer by virtue of the fact that high order services are clustered in the primate city and are not evenly spread throughout the country. 3. When many high order services are only available in a primate city, that city will attract more residents, which means others cities can never grow large enough to attract high order services. So a cycle is created and the primate city grows even larger THREE MODELS OF NORTH AMERICAN CITIES A. Name and verbal description of model (what does the model attempt to describe or predict?): Burgess' Concentric Zone Model Hoyt's Sector Model These three models attempt to describe and predict urban land use and urban growth in North American cities. All were based primarily on the city of Chicago and all are based on the observation that most people prefer to live near others with whom they share similar characteristics. Therefore all three models divide cities into zones each with similar populations or similar land uses. B. Graphic representatio n of model: C. Key points: Harris-Ullman Multiple Nuclei Model Harris-Ullman Multiple Nuclei Model 1. In this model, the city grows out from a Central Business District (CBD) in a series of concentric rings each with different land uses based on level of income. 2. The further one moves from the CBD, the greater the wealth because only more wealthy people (according to this model) can afford to commute into the CBD every day. 3. Therefore Zone 2 (Zone in Transition) contains poorer residents, industry, and warehouses while Zone 3 (Commuter Zone) contains homes for the wealthy. 1. Similar land uses and socioeconomic groups cluster in pie shaped sectors radiating outward from a central business district, usually along transportation corridors. 2. Notice that both high cost residential areas (Zone 5 above) and Low-class residential (Zone 3 above) tend to remain within their respective sectors, both following some corridor of transportation (railway, river, highway, etc.). 1. Harris and Ullman saw that the modern city has more than one center (CBD or downtown) around which activities revolve. 2. Examples of these multiple nodes or nuclei include ports, airports, universities, parks, hospitals, neighborhood business districts, and edge cities. 3. Different nodes attract different land uses. For example, a university might attract pizzerias or bookstores while an airport might attract hotels and warehouses. (GRIFFEN-FORD) LATIN AMERICAN CITY MODEL A. Verbal description of model (what does the model attempt to describe or predict?): The Latin American City model attempts to describe and predict urban land use and growth in Latin American cities. B. Graphic representation of model: C. Key points: 1. The wealthy elite live in an elite residential sector (black in above map) on either side of a spine or wide boulevard leading outward from a central plaza in the Central Business District. 2. These wide boulevards were built according to Spanish colonial laws and came to symbolize wealth and status. They thus became locations for the elites and wealthy of the community. 3. Most of the poor in Latin American cities (according to this model) live on the outskirts of the city in squatter settlements (light color in above map). However, note that some poor live in "Zones of Disamenity" closer to the center of the city. These are undesirable areas such as river banks, steep hillsides, and polluted areas such as industrial parks and trash dumps. But they do give poorer residents greater access to the jobs and services in the CBD (Central Business District). URBAN REALMS MODEL A. Verbal description of model (what does the model attempt to describe or predict?): The Urban Realms Model is a 1970's model of urban land use based on the city of San Francisco. It attempts to explain to explain and predict changing urban growth patterns caused by the increasing importance of the automobile. B. Graphic representation of model: C. Key points: 1. Cities are made up of small "realms" which are self-sufficient urban areas with independent focal points. 2. This model does a good job at explaining suburban growth and how certain functions that are normally found in the CBD can be moved to the suburbs (such as shopping malls, hospitals, schools, etc.). These functions diminish the importance of the CBD and instead create distant realms that accomplish approximately the same thing. 3. Similar to Multiple Nuclei Model but different in that the Urban Realms Model emphasizes the role of the automobile in creating self sufficient "edge cities" that essentially function as new, independent downtowns or CBDs.
