1s Electron Location Lab Report
advertisement
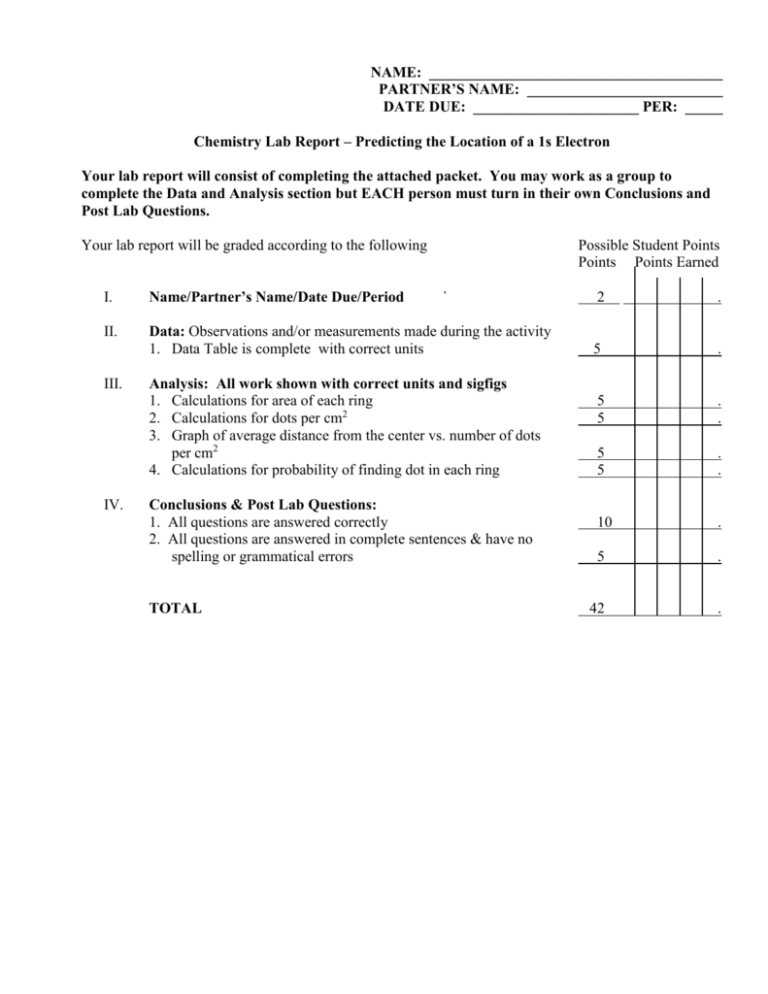
NAME: _______________________________________ PARTNER’S NAME: __________________________ DATE DUE: ______________________ PER: _____ Chemistry Lab Report – Predicting the Location of a 1s Electron Your lab report will consist of completing the attached packet. You may work as a group to complete the Data and Analysis section but EACH person must turn in their own Conclusions and Post Lab Questions. Your lab report will be graded according to the following Possible Student Points Points Points Earned I. Name/Partner’s Name/Date Due/Period II. Data: Observations and/or measurements made during the activity 1. Data Table is complete with correct units III. IV. ` Analysis: All work shown with correct units and sigfigs 1. Calculations for area of each ring 2. Calculations for dots per cm2 3. Graph of average distance from the center vs. number of dots per cm2 4. Calculations for probability of finding dot in each ring Conclusions & Post Lab Questions: 1. All questions are answered correctly 2. All questions are answered in complete sentences & have no spelling or grammatical errors TOTAL 2 . 5 . 5 5 . . 5 5 . . 10 . 5 . 42 . Chemistry Lab – Predicting the Location of a 1s Electron Problem: Where is a 1s electron most likely to be found? Materials (per group): Section of newspaper, sheet of paper with target drawn on it, piece of tape, pen/pencil Procedure: 1. Using the target on the sheet of paper complete the data collection. The center of the target represents the atom’s nucleus, which is very small in comparison to the rest of the atom. There are 5 concentric circles around the dot so that the radius of each circle is 2.0 cm greater than that of the preceding circle. 2. Place a section of newspaper on the floor and tape the target to the paper so that it will not move. 3. Stand on the opposite side of the target from your partner. Holding a pen/pencil at shoulder height above the center of the target, take turns dropping the pen/pencil so that it leaves a dot when it hits the target. Aim for the center of the target. Each dot represents the location of an electron at that moment. 4. Continue dropping the pen/pencil until you each have 50 “electron” dots on your target. 5. Count the number of dots in each ring and record that number in the data table below. Data Table Ring Number Average Distance From Center 1 2.0 cm 2 4.0 cm 3 6.0 cm 4 8.0 cm 5 10.0 cm Area of Ring Number of Dots in Ring Dots per cm2 Analysis: 1. Show calculations for area of each ring here: 2. Show calculations for dots per cm2 for each ring here: 3. On a separate sheet of graph paper, make a graph of your observations by plotting the average distance from the center on the x-axis and the number of dots per cm2 on the y-axis. (Do not forget to use T.A.I.L.S for the graphing) 4. Determine the probability of finding a dot in each of the rings in the target by dividing the number of dots in the ring by the total number of dots that you and your partner made. Multiplying this fraction by 100 will give you the percent probability. Show these calculations here: BONUS +5 An atomic orbital is defined as the region within which an electron is found 90% of the time. On your target, draw a circle within which 90% of the dots are found. Use a different color from the one you used on the target. What is the distance of this circle from the center? What is the area of this circle? Show all work here. NAME: _______________________________ DATE: _______________ PER: ___________ Conclusions & Post Lab Questions – Answered in complete sentences. 1. What happens to the number of dots per unit area as the distance from the center increases? 2. Based on your graph, what is the distance with the highest probability of finding a dot? Explain how you determined this answer. 3. Based on your calculations how many dots are actually located at the distance of highest probability? 4. In an actual atom, will there necessarily be an electron at the distance with the highest probability of finding an electron? Explain your answer. 5. What are two ways is this model is similar to the structure of an atom? What are two ways it is different? NAME: _______________________________ DATE: _______________ PER: ___________ Conclusions & Post Lab Questions – Answered in complete sentences. 1. What happens to the number of dots per unit area as the distance from the center increases? 2. Based on your graph, what is the distance with the highest probability of finding a dot? Explain how you determined this answer. 3. Based on your calculations how many dots are actually located at the distance of highest probability? 4. In an actual atom, will there necessarily be an electron at the distance with the highest probability of finding an electron? Explain your answer. 5. What are two ways is this model is similar to the structure of an atom? What are two ways it is different?
