Revisit of Osmosis Data Analysis and Conclusions
advertisement
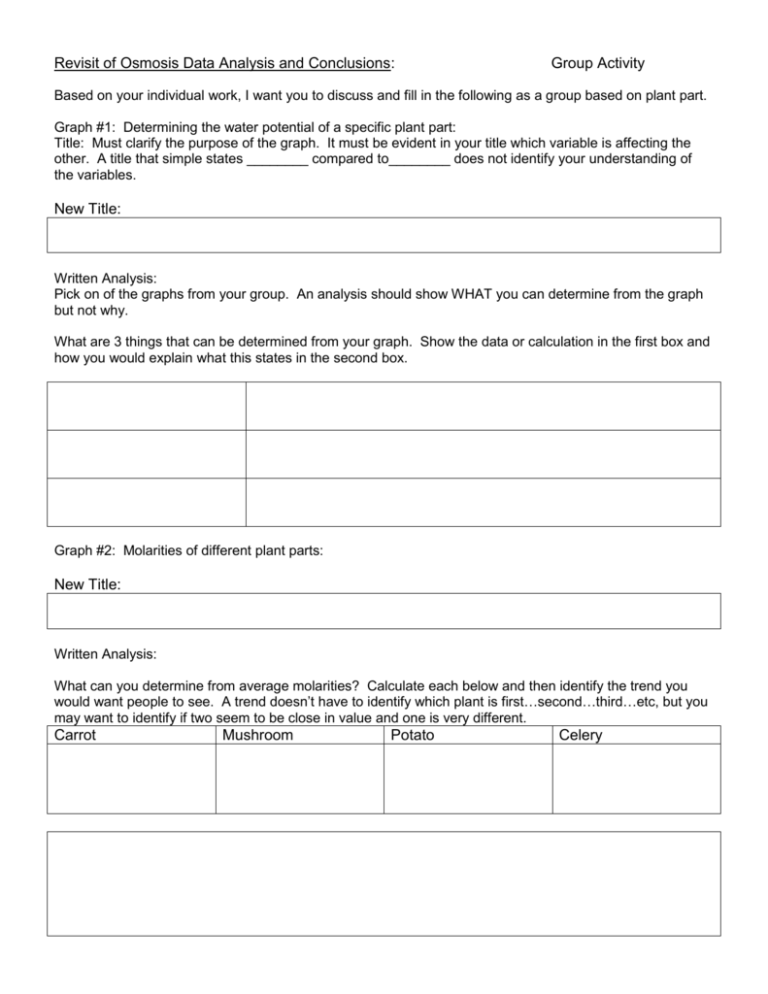
Revisit of Osmosis Data Analysis and Conclusions: Group Activity Based on your individual work, I want you to discuss and fill in the following as a group based on plant part. Graph #1: Determining the water potential of a specific plant part: Title: Must clarify the purpose of the graph. It must be evident in your title which variable is affecting the other. A title that simple states ________ compared to________ does not identify your understanding of the variables. New Title: Written Analysis: Pick on of the graphs from your group. An analysis should show WHAT you can determine from the graph but not why. What are 3 things that can be determined from your graph. Show the data or calculation in the first box and how you would explain what this states in the second box. Graph #2: Molarities of different plant parts: New Title: Written Analysis: What can you determine from average molarities? Calculate each below and then identify the trend you would want people to see. A trend doesn’t have to identify which plant is first…second…third…etc, but you may want to identify if two seem to be close in value and one is very different. Carrot Mushroom Potato Celery Error bars only can be compared when they are understood relative to the bar that they are measuring. One way to do this is looking at error as a percent of the average. Calculate for each bar. Then use this information to write a trend about which plant part has the most variability and which has the least. Carrot Mushroom Potato Celery Conclusion: Conclusions connect to information we have learned or information you research to explain why the trends in the data exist. To do this, you must also cite the relevant values from the data. Part 1: Your plant part…you may pick one person’s data or combine data from groups to make discuss this conclusion. In your explanation you must include relevant vocabulary (think…flaccid, turgid, equilibrium, etc) Discussion points Molarity Osmotic Potential Variability (not as a source of error but as a function of the plant organ) Data to cite Explanation Part 2: Comparison of plant parts (fungi). You need to show your knowledge of transport in a plant system. Adding to this you need to cite information from the data that shows that this makes sense. Plant Part Describe Role in transport 2 Pieces of data that you Description of why the data is can discuss to connect relevant to your understanding to the role in transport. of plant transport Root Stem Leave Fungi “stem” Part 3: Discussion of error. You need to cite specific data to suggest that there is error (there always is error). Then you need to discuss why this may have occurred and how you would improve the experiment how you would go about seeing if the error is just based on variation. Data Discussion Improvments Reflection as a group: 4-All group members are confident 3-Some group members are confident 2-Many group members are not confident 1-All group members are not confident Statement Before this lab/activity After this lab/activity Ability to make a scatterplot with a best fit line choosing the appropriate linear relationship and adding R2 Analyze data from a best fit line (eg. Solve for x when you know y) and discuss the meaning of R2 Ability to make a bar graph with either 2 SEM or standard deviation error bars. Ability to use error bars to analyze the variability with data. How to relate error bars of different sizes; when to use SD and when to use 2SEM Ability to cite specific data and connect to why the data is seen. Ability to relate the lab as a small segment to the bigger picture and connect the very specific data seen in the lab to the larger picture. Ability to use specific measures of precision and accuracy to discuss error and offer improvments. Grade: Section Graph 1 (title and analysis) Graph 2 (title and analysis) Conclusion Connections Error Comments Score

