Spreadsheet exercise – guidelines for solution
advertisement
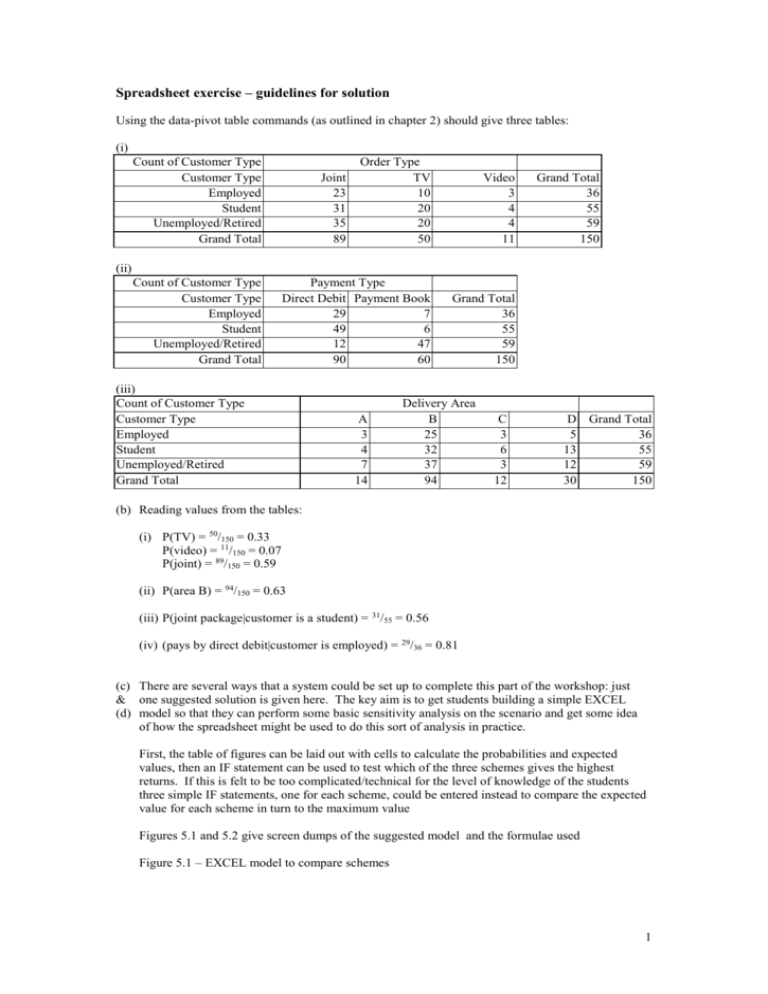
Spreadsheet exercise – guidelines for solution Using the data-pivot table commands (as outlined in chapter 2) should give three tables: (i) Count of Customer Type Customer Type Employed Student Unemployed/Retired Grand Total Order Type TV 10 20 20 50 Video 3 4 4 11 Payment Type Direct Debit Payment Book 29 7 49 6 12 47 90 60 Grand Total 36 55 59 150 Joint 23 31 35 89 Grand Total 36 55 59 150 (ii) Count of Customer Type Customer Type Employed Student Unemployed/Retired Grand Total (iii) Count of Customer Type Customer Type Employed Student Unemployed/Retired Grand Total A 3 4 7 14 Delivery Area B 25 32 37 94 C 3 6 3 12 D Grand Total 5 36 13 55 12 59 30 150 (b) Reading values from the tables: (i) P(TV) = 50/150 = 0.33 P(video) = 11/150 = 0.07 P(joint) = 89/150 = 0.59 (ii) P(area B) = 94/150 = 0.63 (iii) P(joint package|customer is a student) = 31/55 = 0.56 (iv) (pays by direct debit|customer is employed) = 29/36 = 0.81 (c) There are several ways that a system could be set up to complete this part of the workshop: just & one suggested solution is given here. The key aim is to get students building a simple EXCEL (d) model so that they can perform some basic sensitivity analysis on the scenario and get some idea of how the spreadsheet might be used to do this sort of analysis in practice. First, the table of figures can be laid out with cells to calculate the probabilities and expected values, then an IF statement can be used to test which of the three schemes gives the highest returns. If this is felt to be too complicated/technical for the level of knowledge of the students three simple IF statements, one for each scheme, could be entered instead to compare the expected value for each scheme in turn to the maximum value Figures 5.1 and 5.2 give screen dumps of the suggested model and the formulae used Figure 5.1 – EXCEL model to compare schemes 1 2 Figure 5.2 EXCEL model showing formulae used Students can then experiment by changing the value of 0.7 for the P(high demand) to see where each scheme gives the best return. They should find: 0.00 P(high) 0.28 gives Scheme A 0.29 P(high) 0.66 gives Scheme C 0.67 P(high) 1.00 gives Scheme B 3


