print_voiceover_AScurve
advertisement
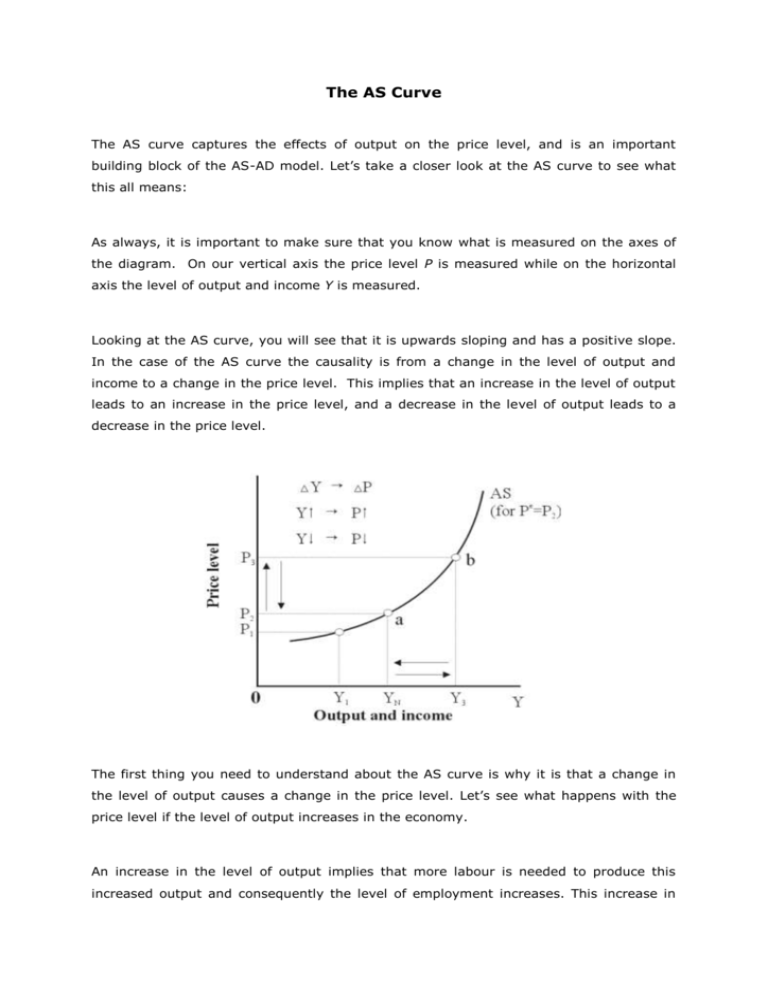
The AS Curve The AS curve captures the effects of output on the price level, and is an important building block of the AS-AD model. Let’s take a closer look at the AS curve to see what this all means: As always, it is important to make sure that you know what is measured on the axes of the diagram. On our vertical axis the price level P is measured while on the horizontal axis the level of output and income Y is measured. Looking at the AS curve, you will see that it is upwards sloping and has a positive slope. In the case of the AS curve the causality is from a change in the level of output and income to a change in the price level. This implies that an increase in the level of output leads to an increase in the price level, and a decrease in the level of output leads to a decrease in the price level. The first thing you need to understand about the AS curve is why it is that a change in the level of output causes a change in the price level. Let’s see what happens with the price level if the level of output increases in the economy. An increase in the level of output implies that more labour is needed to produce this increased output and consequently the level of employment increases. This increase in The AS Curve UNISA Economics Department the level of employment causes a decrease in the level of unemployment. As the level of unemployment decreases, the bargaining position of workers strengthens, which leads to higher bargained nominal wages, which in turn causes an increase in the price level. The link between lower unemployment and higher nominal wages is captured by the wage setting relation. What the wage-setting relation tells us is that the lower the unemployment rate, the greater the bargaining power of workers and the higher the nominal wage they can and will bargain for. The link between an increase in wages and an increase in the price level is provided by the price setting relation. According to the price setting relation the price level is equal to a mark-up over costs, which in this case are the wage costs. As wages increase, the wage costs goes up and so does the price level. What do you think would happen if the level of output declines? As the level of output decreases, employment falls and unemployment increases. An increase in unemployment erodes the bargaining power of workers, and nominal wages decline, which eventually leads to a decline in the price level. A movement along the AS curve therefore indicates a change in the level of output, employment, unemployment, nominal wages and the price level. While the nominal wage changes as we move along an AS curve, the real wage is unchanged. This is due to the way in which the price level is determined in the economy - namely as a mark-up over costs. According to the price setting relation, as nominal wages increase, the price level increases as well. The increase in the nominal wage is therefore offset by an increase in the price level - causing the real wage to remain unchanged along a given AS curve. Workers can determine their nominal wage but not the real wage since the real wage is the outcome of the price setting behaviour in the economy. Another important feature of the AS curve is that at any point on the AS curve the expected price level is the same. The reason for this is that when the wage setting 2 The AS Curve UNISA Economics Department relation and the price setting relation (which is what is behind the positive slope of the AS curve) were derived, we assumed a given and unchanged expected price level. A change in the expected price level will cause a shift of the AS curve. A given AS curve also passes through a point where the level of output is equal to the natural level of output and the actual price level P2 equals the expected price level Pe. This point is indicated by point a. This is also the point where the level of unemployment is such that the bargained real wage is equal to the real wage implied by the price setting. But what about a point such as point b? At a point such as point b, which is to the right of the natural level of output, the level of output is Y3, which is higher than the natural level of output, and the actual price level P3 is higher than the expected price level of P2. This difference between the actual price level and the expected price level will eventually cause the AS curve to shift upwards. But what about a point such as point c? At a point such as point c, which is to the left of the natural level of output, the actual level of output is Y1 - which is lower than the natural level of output and the actual price level P1 is lower than the expected price level of P2. This difference between the actual price level and the expected price level will eventually cause the AS curve to shift downwards. But this is a topic for other time. 3

