Weather Station Models Lab: Earth Science Worksheet
advertisement
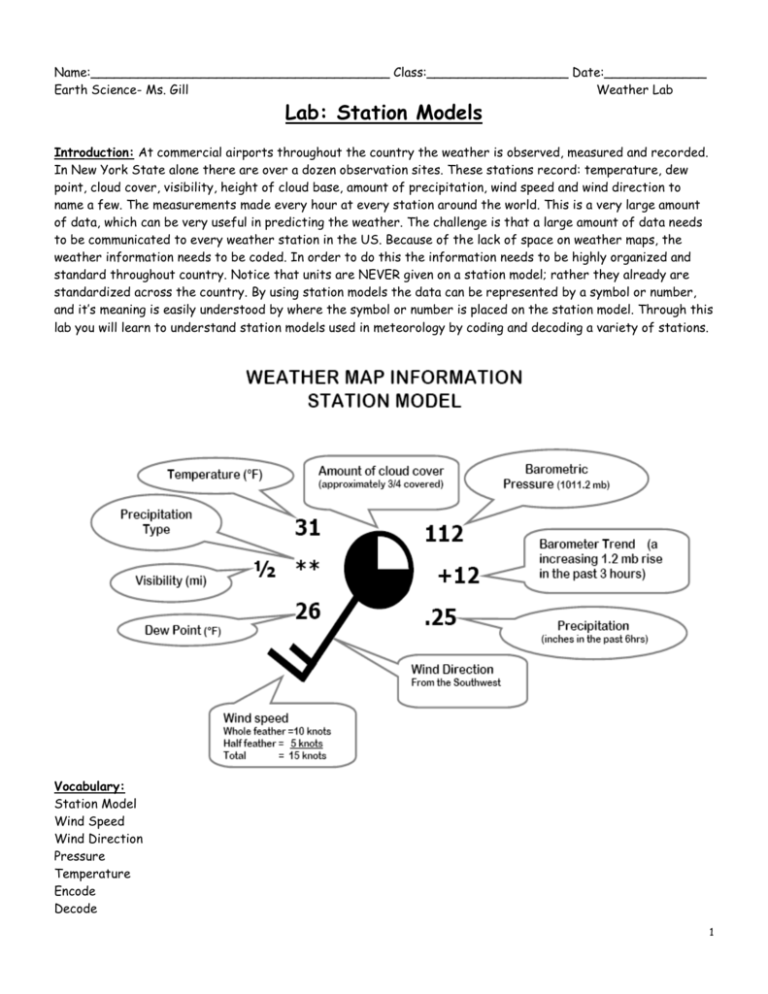
Name:______________________________________ Class:__________________ Date:_____________ Earth Science- Ms. Gill Weather Lab Lab: Station Models Introduction: At commercial airports throughout the country the weather is observed, measured and recorded. In New York State alone there are over a dozen observation sites. These stations record: temperature, dew point, cloud cover, visibility, height of cloud base, amount of precipitation, wind speed and wind direction to name a few. The measurements made every hour at every station around the world. This is a very large amount of data, which can be very useful in predicting the weather. The challenge is that a large amount of data needs to be communicated to every weather station in the US. Because of the lack of space on weather maps, the weather information needs to be coded. In order to do this the information needs to be highly organized and standard throughout country. Notice that units are NEVER given on a station model; rather they already are standardized across the country. By using station models the data can be represented by a symbol or number, and it’s meaning is easily understood by where the symbol or number is placed on the station model. Through this lab you will learn to understand station models used in meteorology by coding and decoding a variety of stations. Vocabulary: Station Model Wind Speed Wind Direction Pressure Temperature Encode Decode 1 Procedures Find the long, narrow, vertical chart on your reference tables labeled “Pressure”. What is the highest pressure, in millibars, labeled on that chart? ____________ What is the lowest pressure, in millibars, labeled on the chart?_____________ The two pressures above are the approximate high and low limits of atmospheric air pressures that are observed at the earth’s surface. Meteorologists take advantage of the limited range of observed pressures to encode them on a station model. Current Air Pressure: The following explains how barometric pressures are encoded on a weather map. Example: 1013.7 mb a. Drop the decimal point: 10137 b. Report the last 3 digits: 137 Example: 989.6 mb a. Drop the decimal point: 9896 b. Report the last 3 digits: 896 Try encoding these: 1022.7 = _____________ 998.0 = ___________ When decoding air pressure on a station model, use the following rule: If the air pressure on the station model is 500 or more, place a 9 in front of this number. Also put a decimal point in front of the last number EX: 588= 958.8 millibars I f the air pressure number on the station model is less than 500 add a 10 in front of the number. Also put a decimal point in front of the last number EX: 091=1009.1 millibars The following explains another way that barometric pressures are decoded when reading a weather map: Example: 146 a. Replace the decimal point ex. 14.6 b. Place a “9”, then a “10”, in front of the coded number ex. 914.6 or 1014.6 c. Determine which of the 2 decoded pressures falls within the normal range of pressures at the earth’s surface (960 - 1040 mb). Since 914.6 is below the normal range, 146 is the code for atmospheric pressure of 1014.6 mb. Example: 972 a. Replace the decimal: 97.2 b. Place a 9 and a 10 in front: 997.2 or 1097.2 c. Choose which one is in normal range: 997.2 (just right), 1097.2(too big!) Try decoding these: 127 = ___________ 865 = _____________ 001 = _____________ 2 Past Pressure: Good forecasting requires us to know what the barometer has been doing lately (rising, falling, or holding steady), and where the barometer is heading. This barometric pressure information is indicated in the center right position of the station model circle. Interpret as follows: Example: + 34 / The “+” means that the pressure is higher now than it was 3 hours ago. The “34” is code for 3.4 mb. This is how much higher the barometer is now than it was 3 hours ago. The “/” means the barometer is still rising now. It is called the barometric trend. Example: - 27 \ The “-” means that the pressure is lower now than it was 3 hours ago. The “27” is code for 2.7 mb. This is how much lower the barometer is now than it was 3 hours ago. The “\” means the barometer is still falling now. Example: -31The “-” means that the pressure is lower now than it was 3 hours ago. The “31” is code for 3.1 mb. This is how much lower the barometer is now than it was 3 hours ago. The “ - ” means the barometer is holding steady now. Temperature and Dew point: Are always reported in degrees Fahrenheit (°F) these may need to be converted to degrees Celsius (°C) using the ESRT. Wind direction is measured by where the wind originates. The stick of the station models points in the direction of where the wind comes from. The flags on the stick approximate the speed of the wind, a short flag: 5 knots, a long flag 10 knots and triangle is 50 knots. A knot equals 1.85km/hr or 1.2 mph Cloud Cover is determined by how much of the visible sky is filled with clouds. It does not matter which side is shaded. Precipitation may fall to the earth in many different forms. The form is indicated by a symbol shown below. The water equivalent (the water or melted form of the precipitation) for the last three hours is reported in the station model using inches. 3 Example #1 Wind direction? _________________ Wind speed? __________________ What is the temperature? _______˚F ________ ˚C (use the conversion chart in the reference tables) What is the dew point? _______˚F ________ ˚C What is the present barometer reading at this station?____________ Is the barometer higher or lower than it was 3 hours ago? ____________ How much has the barometer changed in the last three hours?___________ What was the barometer reading 3 hours ago? ___________ What is the barometer doing NOW (rising or falling)?_____________ Example #2 Wind direction? _________________ Wind speed? __________________ What is the temperature? _______˚F ________ ˚C What is the dew point? _______˚F ________ ˚C What is the present barometer reading at this station?____________ Is the barometer higher or lower than it was 3 hours ago? ____________ How much has the barometer changed in the last three hours?___________ What was the barometer reading 3 hours ago? ___________ What is the barometric trend here?_____________ What is the relative humidity of the air at this station? _____________ (This is a little tricky - you'll need to use both charts on page 12 of the ESRT. Use the Dewpoint Chart first, and work 'backwards' to find the difference between the dry bulb and the wet bulb. Use that information to find the RH on the Relative Humidity chart) Example #3 Draw a station model below indicating the following conditions. Overcast skies, Temperature is 78oF, dew point of 74oF, barometer 3 hours ago 1003.6 mb, now 1000.1mb and falling. Wind NNE* at 20 knots, visibility one half mile, light rain falling. Enter only the information that is used on an official station model (for instance, record only the numerical part of the temperature - not the °F label!) *Remember: Winds are named for where they come from. 4 Part 2: Using the station models below, decode the weather conditions and record the information displayed in the following table: 5 Part 3 In the chart below, you find meteorological data that was taken at several different New York State airports. Use this data to create station models for each citylisted in the table. 75% 6 Part 4 The image to the right is part of an actual synoptic weather map of the US from 11 March, 2003. It shows Texas and New Mexico, and parts of the surrounding states, Mexico, and the Gulf of Mexico. The stations have been labeled A - G for the purposes of this exercise. 1) Which station is reporting the lowest temperature? __________ What is that temperature?_________ 2) Which station is reporting the highest dewpoint?________ What is that dewpoint?_________ 3) Which station is reporting the highest air pressure?________ What is that pressure?_________ 4) Which station is reporting the lowest air pressure?________ What is that pressure?_________ 5) Which station probably has the highest relative humidity?_________ How do you know? ___________________________________________________________________________________ ___________________________________________________________________________________ 6) Where is the air at that station coming from?_______________ Which station is probably in the driest air mass?_________How do you know?___________________ ___________________________________________________________________________________ ___________________________________________________________________________________ 7) Where is the air at that station coming from?_______________ Consider the answers to the last 4 questions above, and make a clear, thoughtful statement about relative humidity of air masses that form over water and air masses that form over land. ___________________________________________________________________________________ ___________________________________________________________________________________ ___________________________________________________________________________________ Study the weather stations shown to the right Write the letter (or letters) of the weather station(s) next to each description of weather conditions. a. Wind NW at 40 miles per hour : _________________ b. Wind SE at 15 miles per hour : _________________ c. Overcast : _________________ d. Clear sky : _________________ e. Thunderstorm: _________________ f. Closest to the warm front : _________________ g. Closest to the cold front : _________________ h. Shade the area of the mT air mass in the diagram 7
