03 Oil Spills with Graphing Calculator
advertisement
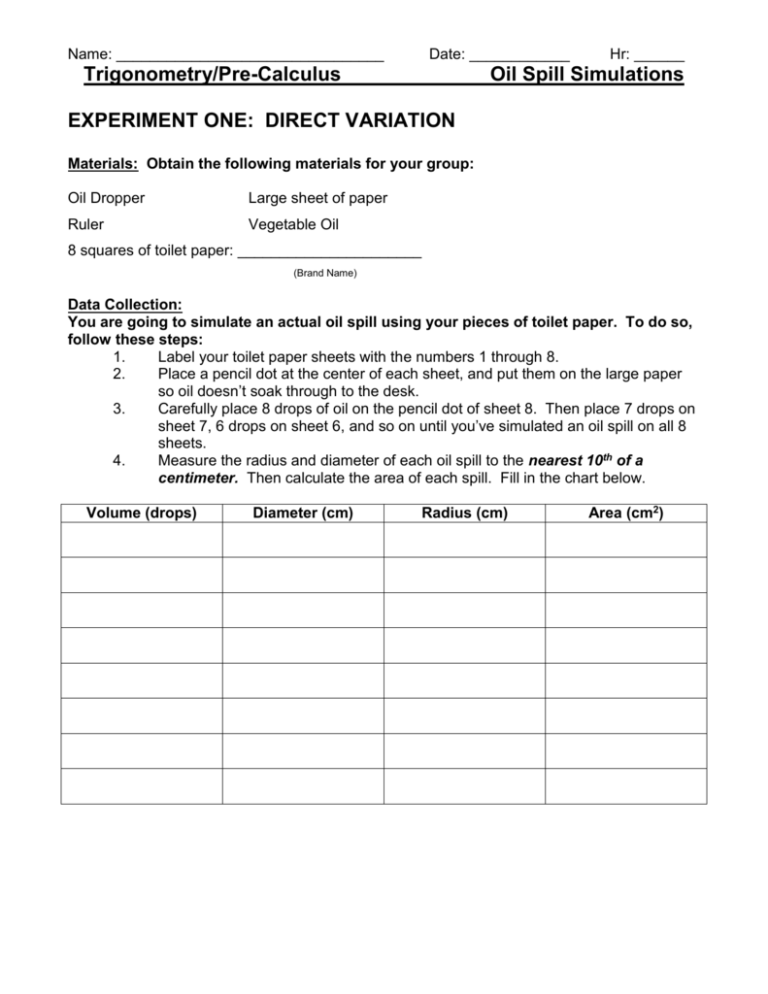
Name: ________________________________ Date: ____________ Trigonometry/Pre-Calculus Hr: ______ Oil Spill Simulations EXPERIMENT ONE: DIRECT VARIATION Materials: Obtain the following materials for your group: Oil Dropper Large sheet of paper Ruler Vegetable Oil 8 squares of toilet paper: ______________________ (Brand Name) Data Collection: You are going to simulate an actual oil spill using your pieces of toilet paper. To do so, follow these steps: 1. Label your toilet paper sheets with the numbers 1 through 8. 2. Place a pencil dot at the center of each sheet, and put them on the large paper so oil doesn’t soak through to the desk. 3. Carefully place 8 drops of oil on the pencil dot of sheet 8. Then place 7 drops on sheet 7, 6 drops on sheet 6, and so on until you’ve simulated an oil spill on all 8 sheets. 4. Measure the radius and diameter of each oil spill to the nearest 10th of a centimeter. Then calculate the area of each spill. Fill in the chart below. Volume (drops) Diameter (cm) Radius (cm) Area (cm2) 5. 6. Enter your data for Volume into List 1 on your graph calculator. Put Area values into List 2. Turn on your STAT PLOT to graph your data. Sketch the graph below. LABEL THE AXES WITH NAMES, NUMBERS, AND UNITS ON YOUR SKETCH!! 7. Use your calculator to get a Linear Regression through your data. Write the linear equation below: 8. In your equation, what do the x and y variables represent? x:________________________________ y:_________________________ 9. Write the value and units of your slope below. Explain the meaning of the slope. 10. Write the value and units of your y-intercept below. Explain the meaning of the yintercept. 11. Suppose you were to use 15 drops of oil. Plug this value into your equation and find the area of the circular oil spill. Show your work. 12. Suppose you had an oil spill with an area of 500 cm 2. Plug this value into your equation and find about how many drops of oil there were. 13. Find the equations of at least 2 other groups and write them below. Also record the brand of toilet paper they were using: 14. Were the equations from the other groups exactly the same as yours? Explain the meaning of any similarities or differences. EXPERIMENT TWO: INVERSE VARIATION As soon as oil is spilled in the ocean, it starts to spread. If not stopped, the oil slick can cover a very large area. As the oil spreads, the depth of the oil slick decreases. In the following exploration, you investigate the relationship between the depth of a spill and the area it covers. In this experiment you will use water to simulate the oil (less messy). Materials: Obtain the following materials for your group: ½ cup of water (about 100 mL) Ruler Cylindrical Containers of different widths (take only a few at a time and then return) Data Collection: You are going to simulate an actual oil spill using your water and different containers. 1. Obtain your first container. Carefully measure the diameter of the base of the container to the nearest 10th of a centimeter. Please measure the inside diameter of the container, not the outside diameter. Ignore the thickness of the container. Put this measurement in the chart. 2. Now calculate the area of the base of the container. Fill this value into the chart. 3. Pour your water into the container. Measure the height of the water from the bottom of the inside of the jar (ignore the thickness of the bottom) to the nearest 10th of a centimeter. Record this value in the chart. 4. Now calculate the volume of your water in the container by multiplying base area time height of the water!! (If you calculate correctly, your water volume should always be the same regardless of your container). 5. Repeat the process with a different container until you have completed the chart below. Container Diameter (cm) Area of Height of Water Volume of Base(cm2) (cm) Water (cm3) A B C D E F G H 6. Enter your data for Base Area into List 1 on your graph calculator. Put Height values into List 2. 7. Turn on your STAT PLOT to graph your data. Sketch the graph below. LABEL THE AXES WITH NAMES, NUMBERS, AND UNITS ON YOUR SKETCH!! 8. Your graph should look like a y = 1/x graph. Press Y= and enter 1/x into Y1. Press GRAPH to see if this equation goes through your data. Keep changing the value on top of your equation (that is, if your equation were written y = k/x, try different values for “k” on your graphing calculator). Check the graph until your equation looks like it is going through your data. Write the best equation below: 9. 10. In your equation, what do the x and y variables represent? x:_______________________________ y:__________________________ 11. In a few complete sentences, explain why this makes sense as an inverse proportion rather than a direct proportion. 12. Suppose you were to use a container that had a base area of about 100 cm 2. Use your equation to find the height of water in your container. 13. Suppose you had a water height of 10 cm. Use your equation to find the base area of your container. Then find the radius that this container would have. 14. Find the equations of two other groups and write them below: 15. Were the equations from the other groups exactly the same as yours? Explain any similarities or differences.
