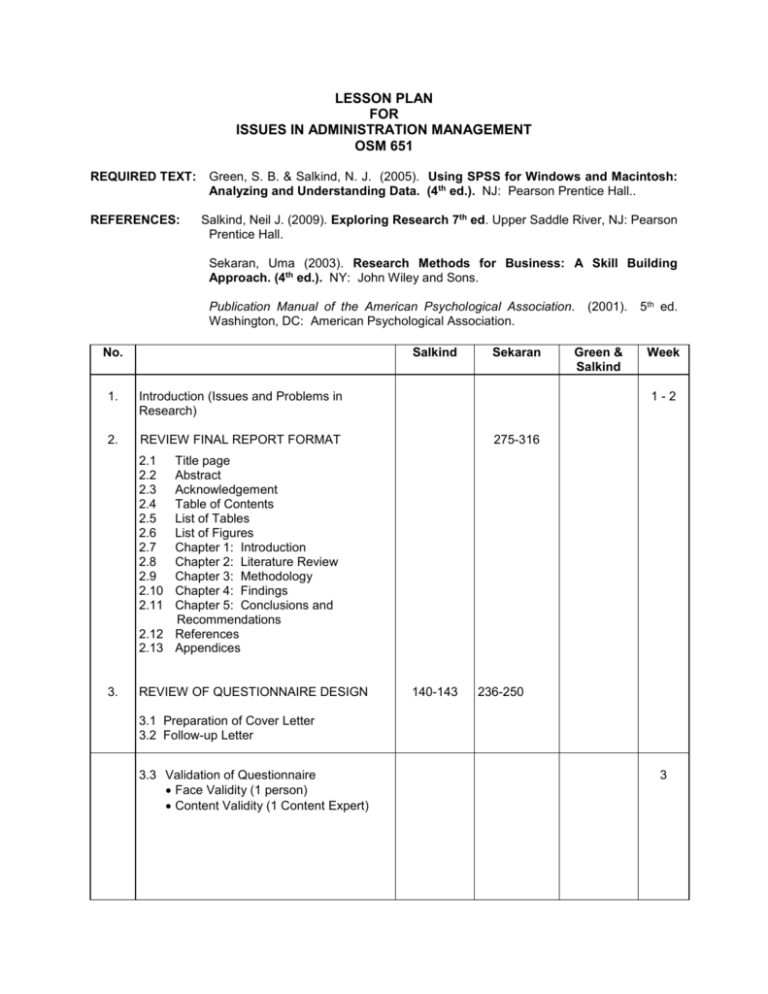
LESSON PLAN
FOR
ISSUES IN ADMINISTRATION MANAGEMENT
OSM 651
REQUIRED TEXT:
REFERENCES:
Green, S. B. & Salkind, N. J. (2005). Using SPSS for Windows and Macintosh:
Analyzing and Understanding Data. (4th ed.). NJ: Pearson Prentice Hall..
Salkind, Neil J. (2009). Exploring Research 7th ed. Upper Saddle River, NJ: Pearson
Prentice Hall.
Sekaran, Uma (2003). Research Methods for Business: A Skill Building
Approach. (4th ed.). NY: John Wiley and Sons.
Publication Manual of the American Psychological Association.
Washington, DC: American Psychological Association.
No.
Salkind
1.
Introduction (Issues and Problems in
Research)
2.
REVIEW FINAL REPORT FORMAT
Sekaran
(2001).
Green &
Salkind
5th ed.
Week
1-2
275-316
2.1
2.2
2.3
2.4
2.5
2.6
2.7
2.8
2.9
2.10
2.11
Title page
Abstract
Acknowledgement
Table of Contents
List of Tables
List of Figures
Chapter 1: Introduction
Chapter 2: Literature Review
Chapter 3: Methodology
Chapter 4: Findings
Chapter 5: Conclusions and
Recommendations
2.12 References
2.13 Appendices
3.
REVIEW OF QUESTIONNAIRE DESIGN
140-143
236-250
3.1 Preparation of Cover Letter
3.2 Follow-up Letter
3.3 Validation of Questionnaire
Face Validity (1 person)
Content Validity (1 Content Expert)
3
No.
4.
PREPARE DATA FOR ANALYSIS
Coding
Input
Data Cleaning
Define variables, cases
Data view, Variable view, Output
Recoding Data
Computing Values
5.
DATA ANALYSIS & INTERPRETATION
DESCRIPTIVE STATISTICS
Univariate Analysis
o Distributions
o Using Graphs
Measures of central tendencies and
dispersions
o Mean
o Median
o Mode
o Standard Deviation
o Variance
6.
INFERENTIAL STATISTICS
One-Sample t-test
Chi-Square test
o Two-way Table Analysis using
Crosstabs
Measures of Association
Correlation Coefficient
Salkind
Sekaran
148-153
301-305
Green &
Salkind
1-16
19-25
155- 57
312-314
129-132
132-135
138-145
6
169-180
399 - 404
155-157
356-373
366-373
254-259
199-203
7
REPORTING THE RESULTS
Univariate Analysis
o Distributions
Measures of central tendencies
One-Sample t-test
Chi-square test
o Two-way Table Analysis using
Crosstabs
Measures of Association
Analysis of open-ended responses
Pattern
Frequencies
3
4 and 5
MID SEMESTER BREAK
7.
Week
8
136
151
159
354
374
259-260
196
409 - 411
9
8.
REPORTING THE RESULTS (CONTD.)
10 and
11
9.
WRITE DISCUSSION, CONCLUSIONS AND
RECOMMENDATIONS
Abstract
12 and
13
QUIZ ON DATA ANALYSIS
SUBMISSION OF SPIRAL-BOUND FINAL PROJECT 2 copies (Yellow Cover)
14
15

